added 18 characters in body
Source Link
Tim
  • 141.1k
  • 26
  • 270
  • 512

having all this you can easily compute the weighted correlation

As aboutfor your second question, as I understand it, you would have data about correlations between political orientation and preference for the twenty artists and users binary answers about his/her preference and you want to get some kind of aggregate measure of it.

Let's start with averaging correlations. There are multiple methods for averaging probabilities, but there doesn'tdon't seem to be so many approaches to averaging correlations. One thing that could be done is to use Fisher's $z$-transformation as described on MathOverflow, i.e.

$$ \bar\rho = \tanh^{-1} \left(\frac{\sum_{j=1}^K \tanh(\rho_j)}{K} \right) $$$$ \bar\rho = \tanh \left(\frac{\sum_{j=1}^K \tanh^{-1}(\rho_j)}{K} \right) $$

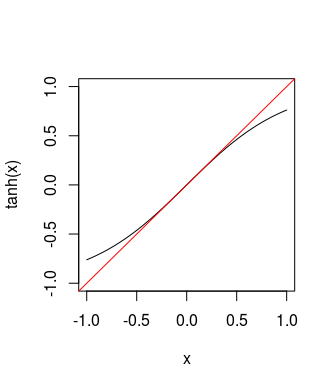
Basically taking tangents of correlation coefficients "flattens"It reduces the extreme values (see below) so they have lower influence onskewness of the final estimatedistribution and makes their distributionit closer to normal. This procedure was also described by Bushman and Wang (1995) and Corey, Dunlap, and Burke (1998).

enter image description here

$$ \bar r_i = \tanh^{-1} \left(\frac{\sum_{j=1}^K \tanh(r_j x_{ij})}{K} \right) $$$$ \bar r_i = \tanh \left(\frac{\sum_{j=1}^K \tanh^{-1}(r_j x_{ij})}{K} \right) $$

i.e. compute average correlation that inverts the signs for correlations accordingly for preferred and disliked artists. By applying such a procedure you end up with the average "correlation" of usersusers' preference and political orientation, that as regular correlation ranges from $-1$ to $1$.

Don't you think that all of this is an overkill for something that is basically a multiple regression problem? Instead of all the weighting and averaging you could simply use weighted multiple regression (linear or logistic depending if you predict binary preference or degree off preference in either direction) where weights are based on sizes of subsamples. You would use musical preference for each artist as a predictor. In the end, you'll use the user's preference to make predictions. This approach is simpler and more statistically elegant. It also applies relative weights to the artists while averaging the correlations doesn't correct for their relative "impact" on the final score. Moreover, regression takes into consideration the base rate (or default political orientation), while averaging correlations does not. Imagine that the vast majority of the population prefers party $A$, this should make you less eager to predict $B$'s, and regression accounts for that by including the intercept. The only problem is multicollinearity but when averaging correlations you ignore it rather thenthan dealing with it.

Corey, D.M., Dunlap, W.P., and Burke, M.J. (1998). Averaging Correlations: Expected Values and Bias in Combined Pearson rs and Fisher's z TransformationsAveraging Correlations: Expected Values and Bias in Combined Pearson rs and Fisher's z Transformations, The Journal of General Psychology, 125(3), 245-261.

having all this you can easily compute weighted correlation

As about your second question, as I understand it, you would have data about correlations between political orientation and preference for the twenty artists and users binary answers about his/her preference and you want to get some kind of aggregate measure of it.

Let's start with averaging correlations. There are multiple methods for averaging probabilities, but there doesn't seem to be so many approaches to averaging correlations. One thing that could be done is to use Fisher's $z$-transformation as described on MathOverflow, i.e.

$$ \bar\rho = \tanh^{-1} \left(\frac{\sum_{j=1}^K \tanh(\rho_j)}{K} \right) $$

Basically taking tangents of correlation coefficients "flattens" the extreme values (see below) so they have lower influence on the final estimate and makes their distribution closer to normal. This procedure was also described by Bushman and Wang (1995) and Corey, Dunlap and Burke (1998).

enter image description here

$$ \bar r_i = \tanh^{-1} \left(\frac{\sum_{j=1}^K \tanh(r_j x_{ij})}{K} \right) $$

i.e. compute average correlation that inverts the signs for correlations accordingly for preferred and disliked artists. By applying such procedure you end up with the average "correlation" of users preference and political orientation, that as regular correlation ranges from $-1$ to $1$.

Don't you think that all of this is an overkill for something that is basically a multiple regression problem? Instead all the weighting and averaging you could simply use weighted multiple regression (linear or logistic depending if you predict binary preference or degree off preference in either direction) where weights are based on sizes of subsamples. You would use musical preference for each artist as predictor. In the end you'll use user's preference to make predictions. This approach is simpler and more statistically elegant. It also applies relative weights to the artists while averaging the correlations doesn't correct for their relative "impact" on the final score. Moreover, regression takes into consideration the base rate (or default political orientation), while averaging correlations does not. Imagine that vast majority of the population prefers party $A$, this should make you less eager to predict $B$'s and regression accounts for that by including intercept. The only problem is multicollinearity but when averaging correlations you ignore it rather then dealing with it.

Corey, D.M., Dunlap, W.P., and Burke, M.J. (1998). Averaging Correlations: Expected Values and Bias in Combined Pearson rs and Fisher's z Transformations, The Journal of General Psychology, 125(3), 245-261.

having all this you can easily compute the weighted correlation

As for your second question, as I understand it, you would have data about correlations between political orientation and preference for the twenty artists and users binary answers about his/her preference and you want to get some kind of aggregate measure of it.

Let's start with averaging correlations. There are multiple methods for averaging probabilities, but there don't seem to be so many approaches to averaging correlations. One thing that could be done is to use Fisher's $z$-transformation as described on MathOverflow, i.e.

$$ \bar\rho = \tanh \left(\frac{\sum_{j=1}^K \tanh^{-1}(\rho_j)}{K} \right) $$

It reduces the skewness of the distribution and makes it closer to normal. This procedure was also described by Bushman and Wang (1995) and Corey, Dunlap, and Burke (1998).

$$ \bar r_i = \tanh \left(\frac{\sum_{j=1}^K \tanh^{-1}(r_j x_{ij})}{K} \right) $$

i.e. compute average correlation that inverts the signs for correlations accordingly for preferred and disliked artists. By applying such a procedure you end up with the average "correlation" of users' preference and political orientation, that as regular correlation ranges from $-1$ to $1$.

Don't you think that all of this is overkill for something that is basically a multiple regression problem? Instead of all the weighting and averaging you could simply use weighted multiple regression (linear or logistic depending if you predict binary preference or degree off preference in either direction) where weights are based on sizes of subsamples. You would use musical preference for each artist as a predictor. In the end, you'll use the user's preference to make predictions. This approach is simpler and more statistically elegant. It also applies relative weights to the artists while averaging the correlations doesn't correct for their relative "impact" on the final score. Moreover, regression takes into consideration the base rate (or default political orientation), while averaging correlations does not. Imagine that the vast majority of the population prefers party $A$, this should make you less eager to predict $B$'s, and regression accounts for that by including the intercept. The only problem is multicollinearity but when averaging correlations you ignore it rather than dealing with it.

Corey, D.M., Dunlap, W.P., and Burke, M.J. (1998). Averaging Correlations: Expected Values and Bias in Combined Pearson rs and Fisher's z Transformations, The Journal of General Psychology, 125(3), 245-261.

added link to python's statsmodels implementation
Source Link

Formula for weighted Pearson correlation can be easily found on the web, StackOverflow, and Wikipedia and is implemented in several R packages e.g. psych, or weights and in Python's statsmodels package. It is calculated like regular correlation but with using weighted means,

$$ m_X = \frac{\sum_i w_i x_i}{\sum_i w_i}, ~~~~ m_Y = \frac{\sum_i w_i y_i}{\sum_i w_i} $$

weighted variances,

$$ s_X = \frac{\sum_i w_i (x_i - m_X)^2}{ \sum_i w_i}, ~~~~ s_Y = \frac{\sum_i w_i (y_i - m_Y)^2}{ \sum_i w_i} $$

and weighted covariance

$$ s_{XY} = \frac{\sum_i w_i (x_i - m_X)(y_i - m_Y)}{ \sum_i w_i} $$

having all this you can easily compute weighted correlation

$$ \rho_{XY} = \frac{s_{XY}}{\sqrt{s_X s_Y}} $$

As about your second question, as I understand it, you would have data about correlations between political orientation and preference for the twenty artists and users binary answers about his/her preference and you want to get some kind of aggregate measure of it.

Let's start with averaging correlations. There are multiple methods for averaging probabilities, but there doesn't seem to be so many approaches to averaging correlations. One thing that could be done is to use Fisher's $z$-transformation as described on MathOverflow, i.e.

$$ \bar\rho = \tanh^{-1} \left(\frac{\sum_{j=1}^K \tanh(\rho_j)}{K} \right) $$

Basically taking tangents of correlation coefficients "flattens" the extreme values (see below) so they have lower influence on the final estimate and makes their distribution closer to normal. This procedure was also described by Bushman and Wang (1995) and Corey, Dunlap and Burke (1998).

enter image description here

Next, you have to notice that if $r = \mathrm{cor}(X,Y)$, then $-r = \mathrm{cor}(-X,Y) = \mathrm{cor}(X,-Y)$, so positive correlation of musical preference with some political orientation is the same as negative correlation of musical dislike to such political orientation, and the other way around.

Now, let's define $r_j$ as correlation of musical preference of $j$-th artist to some political orientation, and $x_{ij}$ as $i$-th users preference for $j$-th artist, where $x_{ij} = 1$ for preference and $x_{ij} = -1$ for dislike. You can define your final estimate as

$$ \bar r_i = \tanh^{-1} \left(\frac{\sum_{j=1}^K \tanh(r_j x_{ij})}{K} \right) $$

i.e. compute average correlation that inverts the signs for correlations accordingly for preferred and disliked artists. By applying such procedure you end up with the average "correlation" of users preference and political orientation, that as regular correlation ranges from $-1$ to $1$.

But...

Don't you think that all of this is an overkill for something that is basically a multiple regression problem? Instead all the weighting and averaging you could simply use weighted multiple regression (linear or logistic depending if you predict binary preference or degree off preference in either direction) where weights are based on sizes of subsamples. You would use musical preference for each artist as predictor. In the end you'll use user's preference to make predictions. This approach is simpler and more statistically elegant. It also applies relative weights to the artists while averaging the correlations doesn't correct for their relative "impact" on the final score. Moreover, regression takes into consideration the base rate (or default political orientation), while averaging correlations does not. Imagine that vast majority of the population prefers party $A$, this should make you less eager to predict $B$'s and regression accounts for that by including intercept. The only problem is multicollinearity but when averaging correlations you ignore it rather then dealing with it.


Bushman, B.J., & Wang, M.C. (1995). A procedure for combining sample correlation coefficients and vote counts to obtain an estimate and a confidence interval for the population correlation coefficient. Psychological Bulletin, 117(3), 530.

Corey, D.M., Dunlap, W.P., and Burke, M.J. (1998). Averaging Correlations: Expected Values and Bias in Combined Pearson rs and Fisher's z Transformations, The Journal of General Psychology, 125(3), 245-261.

Formula for weighted Pearson correlation can be easily found on the web, StackOverflow, and Wikipedia and is implemented in several R packages e.g. psych, or weights. It is calculated like regular correlation but with using weighted means,

$$ m_X = \frac{\sum_i w_i x_i}{\sum_i w_i}, ~~~~ m_Y = \frac{\sum_i w_i y_i}{\sum_i w_i} $$

weighted variances,

$$ s_X = \frac{\sum_i w_i (x_i - m_X)^2}{ \sum_i w_i}, ~~~~ s_Y = \frac{\sum_i w_i (y_i - m_Y)^2}{ \sum_i w_i} $$

and weighted covariance

$$ s_{XY} = \frac{\sum_i w_i (x_i - m_X)(y_i - m_Y)}{ \sum_i w_i} $$

having all this you can easily compute weighted correlation

$$ \rho_{XY} = \frac{s_{XY}}{\sqrt{s_X s_Y}} $$

As about your second question, as I understand it, you would have data about correlations between political orientation and preference for the twenty artists and users binary answers about his/her preference and you want to get some kind of aggregate measure of it.

Let's start with averaging correlations. There are multiple methods for averaging probabilities, but there doesn't seem to be so many approaches to averaging correlations. One thing that could be done is to use Fisher's $z$-transformation as described on MathOverflow, i.e.

$$ \bar\rho = \tanh^{-1} \left(\frac{\sum_{j=1}^K \tanh(\rho_j)}{K} \right) $$

Basically taking tangents of correlation coefficients "flattens" the extreme values (see below) so they have lower influence on the final estimate and makes their distribution closer to normal. This procedure was also described by Bushman and Wang (1995) and Corey, Dunlap and Burke (1998).

enter image description here

Next, you have to notice that if $r = \mathrm{cor}(X,Y)$, then $-r = \mathrm{cor}(-X,Y) = \mathrm{cor}(X,-Y)$, so positive correlation of musical preference with some political orientation is the same as negative correlation of musical dislike to such political orientation, and the other way around.

Now, let's define $r_j$ as correlation of musical preference of $j$-th artist to some political orientation, and $x_{ij}$ as $i$-th users preference for $j$-th artist, where $x_{ij} = 1$ for preference and $x_{ij} = -1$ for dislike. You can define your final estimate as

$$ \bar r_i = \tanh^{-1} \left(\frac{\sum_{j=1}^K \tanh(r_j x_{ij})}{K} \right) $$

i.e. compute average correlation that inverts the signs for correlations accordingly for preferred and disliked artists. By applying such procedure you end up with the average "correlation" of users preference and political orientation, that as regular correlation ranges from $-1$ to $1$.

But...

Don't you think that all of this is an overkill for something that is basically a multiple regression problem? Instead all the weighting and averaging you could simply use weighted multiple regression (linear or logistic depending if you predict binary preference or degree off preference in either direction) where weights are based on sizes of subsamples. You would use musical preference for each artist as predictor. In the end you'll use user's preference to make predictions. This approach is simpler and more statistically elegant. It also applies relative weights to the artists while averaging the correlations doesn't correct for their relative "impact" on the final score. Moreover, regression takes into consideration the base rate (or default political orientation), while averaging correlations does not. Imagine that vast majority of the population prefers party $A$, this should make you less eager to predict $B$'s and regression accounts for that by including intercept. The only problem is multicollinearity but when averaging correlations you ignore it rather then dealing with it.


Bushman, B.J., & Wang, M.C. (1995). A procedure for combining sample correlation coefficients and vote counts to obtain an estimate and a confidence interval for the population correlation coefficient. Psychological Bulletin, 117(3), 530.

Corey, D.M., Dunlap, W.P., and Burke, M.J. (1998). Averaging Correlations: Expected Values and Bias in Combined Pearson rs and Fisher's z Transformations, The Journal of General Psychology, 125(3), 245-261.

Formula for weighted Pearson correlation can be easily found on the web, StackOverflow, and Wikipedia and is implemented in several R packages e.g. psych, or weights and in Python's statsmodels package. It is calculated like regular correlation but with using weighted means,

$$ m_X = \frac{\sum_i w_i x_i}{\sum_i w_i}, ~~~~ m_Y = \frac{\sum_i w_i y_i}{\sum_i w_i} $$

weighted variances,

$$ s_X = \frac{\sum_i w_i (x_i - m_X)^2}{ \sum_i w_i}, ~~~~ s_Y = \frac{\sum_i w_i (y_i - m_Y)^2}{ \sum_i w_i} $$

and weighted covariance

$$ s_{XY} = \frac{\sum_i w_i (x_i - m_X)(y_i - m_Y)}{ \sum_i w_i} $$

having all this you can easily compute weighted correlation

$$ \rho_{XY} = \frac{s_{XY}}{\sqrt{s_X s_Y}} $$

As about your second question, as I understand it, you would have data about correlations between political orientation and preference for the twenty artists and users binary answers about his/her preference and you want to get some kind of aggregate measure of it.

Let's start with averaging correlations. There are multiple methods for averaging probabilities, but there doesn't seem to be so many approaches to averaging correlations. One thing that could be done is to use Fisher's $z$-transformation as described on MathOverflow, i.e.

$$ \bar\rho = \tanh^{-1} \left(\frac{\sum_{j=1}^K \tanh(\rho_j)}{K} \right) $$

Basically taking tangents of correlation coefficients "flattens" the extreme values (see below) so they have lower influence on the final estimate and makes their distribution closer to normal. This procedure was also described by Bushman and Wang (1995) and Corey, Dunlap and Burke (1998).

enter image description here

Next, you have to notice that if $r = \mathrm{cor}(X,Y)$, then $-r = \mathrm{cor}(-X,Y) = \mathrm{cor}(X,-Y)$, so positive correlation of musical preference with some political orientation is the same as negative correlation of musical dislike to such political orientation, and the other way around.

Now, let's define $r_j$ as correlation of musical preference of $j$-th artist to some political orientation, and $x_{ij}$ as $i$-th users preference for $j$-th artist, where $x_{ij} = 1$ for preference and $x_{ij} = -1$ for dislike. You can define your final estimate as

$$ \bar r_i = \tanh^{-1} \left(\frac{\sum_{j=1}^K \tanh(r_j x_{ij})}{K} \right) $$

i.e. compute average correlation that inverts the signs for correlations accordingly for preferred and disliked artists. By applying such procedure you end up with the average "correlation" of users preference and political orientation, that as regular correlation ranges from $-1$ to $1$.

But...

Don't you think that all of this is an overkill for something that is basically a multiple regression problem? Instead all the weighting and averaging you could simply use weighted multiple regression (linear or logistic depending if you predict binary preference or degree off preference in either direction) where weights are based on sizes of subsamples. You would use musical preference for each artist as predictor. In the end you'll use user's preference to make predictions. This approach is simpler and more statistically elegant. It also applies relative weights to the artists while averaging the correlations doesn't correct for their relative "impact" on the final score. Moreover, regression takes into consideration the base rate (or default political orientation), while averaging correlations does not. Imagine that vast majority of the population prefers party $A$, this should make you less eager to predict $B$'s and regression accounts for that by including intercept. The only problem is multicollinearity but when averaging correlations you ignore it rather then dealing with it.


Bushman, B.J., & Wang, M.C. (1995). A procedure for combining sample correlation coefficients and vote counts to obtain an estimate and a confidence interval for the population correlation coefficient. Psychological Bulletin, 117(3), 530.

Corey, D.M., Dunlap, W.P., and Burke, M.J. (1998). Averaging Correlations: Expected Values and Bias in Combined Pearson rs and Fisher's z Transformations, The Journal of General Psychology, 125(3), 245-261.

added 246 characters in body
Source Link
Tim
  • 141.1k
  • 26
  • 270
  • 512

Formula for weighted Pearson correlation can be easily found on the web, StackOverflow, and Wikipedia and is implemented in several R packages e.g. psych, or weights. It is calculated like regular correlation but with using weighted means,

$$ m_X = \frac{\sum_i w_i x_i}{\sum_i w_i}, ~~~~ m_Y = \frac{\sum_i w_i y_i}{\sum_i w_i} $$

weighted variances,

$$ s_X = \frac{\sum_i w_i (x_i - m_X)^2}{ \sum_i w_i}, ~~~~ s_Y = \frac{\sum_i w_i (y_i - m_Y)^2}{ \sum_i w_i} $$

and weighted covariance

$$ s_{XY} = \frac{\sum_i w_i (x_i - m_X)(y_i - m_Y)}{ \sum_i w_i} $$

having all this you can easily compute weighted correlation

$$ \rho_{XY} = \frac{s_{XY}}{\sqrt{s_X s_Y}} $$

As about your second question, as I understand it, you would have data about correlations between political orientation and preference for the twenty artists and users binary answers about his/her preference and you want to get some kind of aggregate measure of it.

Let's start with averaging correlations. There are multiple methods for averaging probabilities, but there doesn't seem to be so many approaches to averaging correlations. One thing that could be done is to use Fisher's $z$-transformation as described on MathOverflow, i.e.

$$ \bar\rho = \tanh^{-1} \left(\frac{\sum_{j=1}^K \tanh(\rho_j)}{K} \right) $$

Basically taking tangents of correlation coefficients "flattens" the extreme values (see below) so they have lower influence on the final estimate and makes their distribution closer to normal. This procedure was also described by Bushman and Wang (1995) and Corey, Dunlap and Burke (1998).

enter image description here

Next, you have to notice that if $r = \mathrm{cor}(X,Y)$, then $-r = \mathrm{cor}(-X,Y) = \mathrm{cor}(X,-Y)$, so positive correlation of musical preference with some political orientation is the same as negative correlation of musical dislike to such political orientation, and the other way around.

Now, let's define $r_j$ as correlation of musical preference of $j$-th artist to some political orientation, and $x_{ij}$ as $i$-th users preference for $j$-th artist, where $x_{ij} = 1$ for preference and $x_{ij} = -1$ for dislike. You can define your final estimate as

$$ \bar r_i = \tanh^{-1} \left(\frac{\sum_{j=1}^K \tanh(r_j x_{ij})}{K} \right) $$

i.e. compute average correlation that inverts the signs for correlations accordingly for preferred and disliked artists. By applying such procedure you end up with the average "correlation" of users preference and political orientation, that as regular correlation ranges from $-1$ to $1$.

But...

Don't you think that all of this is an overkill for something that is basically a multiple regression problem? Instead all the weighting and averaging you could simply use weighted multiple regression (linear or logistic depending if you predict binary preference or degree off preference in either direction) where weights are based on sizes of subsamples. You would use musical preference for each artist as predictor. In the end you'll use user's preference to make predictions. This approach is simpler and more statistically elegant. It also applies relative weights to the artists while averaging the correlations doesn't correct for their relative "impact" on the final score. Moreover, regression takes into consideration the base rate (or default political orientation), while averaging correlations does not. Imagine that vast majority of the population prefers party $A$, this should make you less eager to predict $B$'s and regression accounts for that by including intercept. The only problem is multicollinearity but when averaging correlations you ignore it rather then dealing with it.


Bushman, B.J., & Wang, M.C. (1995). A procedure for combining sample correlation coefficients and vote counts to obtain an estimate and a confidence interval for the population correlation coefficient. Psychological Bulletin, 117(3), 530.

Corey, D.M., Dunlap, W.P., and Burke, M.J. (1998). Averaging Correlations: Expected Values and Bias in Combined Pearson rs and Fisher's z Transformations, The Journal of General Psychology, 125(3), 245-261.

Formula for weighted Pearson correlation can be easily found on the web, StackOverflow, and Wikipedia and is implemented in several R packages e.g. psych, or weights. It is calculated like regular correlation but with using weighted means,

$$ m_X = \frac{\sum_i w_i x_i}{\sum_i w_i}, ~~~~ m_Y = \frac{\sum_i w_i y_i}{\sum_i w_i} $$

weighted variances,

$$ s_X = \frac{\sum_i w_i (x_i - m_X)^2}{ \sum_i w_i}, ~~~~ s_Y = \frac{\sum_i w_i (y_i - m_Y)^2}{ \sum_i w_i} $$

and weighted covariance

$$ s_{XY} = \frac{\sum_i w_i (x_i - m_X)(y_i - m_Y)}{ \sum_i w_i} $$

having all this you can easily compute weighted correlation

$$ \rho_{XY} = \frac{s_{XY}}{\sqrt{s_X s_Y}} $$

As about your second question, as I understand it, you would have data about correlations between political orientation and preference for the twenty artists and users binary answers about his/her preference and you want to get some kind of aggregate measure of it.

Let's start with averaging correlations. There are multiple methods for averaging probabilities, but there doesn't seem to be so many approaches to averaging correlations. One thing that could be done is to use Fisher's $z$-transformation as described on MathOverflow, i.e.

$$ \bar\rho = \tanh^{-1} \left(\frac{\sum_{j=1}^K \tanh(\rho_j)}{K} \right) $$

Basically taking tangents of correlation coefficients "flattens" the extreme values (see below) so they have lower influence on the final estimate and makes their distribution closer to normal. This procedure was also described by Bushman and Wang (1995).

enter image description here

Next, you have to notice that if $r = \mathrm{cor}(X,Y)$, then $-r = \mathrm{cor}(-X,Y) = \mathrm{cor}(X,-Y)$, so positive correlation of musical preference with some political orientation is the same as negative correlation of musical dislike to such political orientation, and the other way around.

Now, let's define $r_j$ as correlation of musical preference of $j$-th artist to some political orientation, and $x_{ij}$ as $i$-th users preference for $j$-th artist, where $x_{ij} = 1$ for preference and $x_{ij} = -1$ for dislike. You can define your final estimate as

$$ \bar r_i = \tanh^{-1} \left(\frac{\sum_{j=1}^K \tanh(r_j x_{ij})}{K} \right) $$

i.e. compute average correlation that inverts the signs for correlations accordingly for preferred and disliked artists. By applying such procedure you end up with the average "correlation" of users preference and political orientation, that as regular correlation ranges from $-1$ to $1$.

But...

Don't you think that all of this is an overkill for something that is basically a multiple regression problem? Instead all the weighting and averaging you could simply use weighted multiple regression (linear or logistic depending if you predict binary preference or degree off preference in either direction) where weights are based on sizes of subsamples. You would use musical preference for each artist as predictor. In the end you'll use user's preference to make predictions. This approach is simpler and more statistically elegant. It also applies relative weights to the artists while averaging the correlations doesn't correct for their relative "impact" on the final score. Moreover, regression takes into consideration the base rate (or default political orientation), while averaging correlations does not. Imagine that vast majority of the population prefers party $A$, this should make you less eager to predict $B$'s and regression accounts for that by including intercept. The only problem is multicollinearity but when averaging correlations you ignore it rather then dealing with it.


Bushman, B.J., & Wang, M.C. (1995). A procedure for combining sample correlation coefficients and vote counts to obtain an estimate and a confidence interval for the population correlation coefficient. Psychological Bulletin, 117(3), 530.

Formula for weighted Pearson correlation can be easily found on the web, StackOverflow, and Wikipedia and is implemented in several R packages e.g. psych, or weights. It is calculated like regular correlation but with using weighted means,

$$ m_X = \frac{\sum_i w_i x_i}{\sum_i w_i}, ~~~~ m_Y = \frac{\sum_i w_i y_i}{\sum_i w_i} $$

weighted variances,

$$ s_X = \frac{\sum_i w_i (x_i - m_X)^2}{ \sum_i w_i}, ~~~~ s_Y = \frac{\sum_i w_i (y_i - m_Y)^2}{ \sum_i w_i} $$

and weighted covariance

$$ s_{XY} = \frac{\sum_i w_i (x_i - m_X)(y_i - m_Y)}{ \sum_i w_i} $$

having all this you can easily compute weighted correlation

$$ \rho_{XY} = \frac{s_{XY}}{\sqrt{s_X s_Y}} $$

As about your second question, as I understand it, you would have data about correlations between political orientation and preference for the twenty artists and users binary answers about his/her preference and you want to get some kind of aggregate measure of it.

Let's start with averaging correlations. There are multiple methods for averaging probabilities, but there doesn't seem to be so many approaches to averaging correlations. One thing that could be done is to use Fisher's $z$-transformation as described on MathOverflow, i.e.

$$ \bar\rho = \tanh^{-1} \left(\frac{\sum_{j=1}^K \tanh(\rho_j)}{K} \right) $$

Basically taking tangents of correlation coefficients "flattens" the extreme values (see below) so they have lower influence on the final estimate and makes their distribution closer to normal. This procedure was also described by Bushman and Wang (1995) and Corey, Dunlap and Burke (1998).

enter image description here

Next, you have to notice that if $r = \mathrm{cor}(X,Y)$, then $-r = \mathrm{cor}(-X,Y) = \mathrm{cor}(X,-Y)$, so positive correlation of musical preference with some political orientation is the same as negative correlation of musical dislike to such political orientation, and the other way around.

Now, let's define $r_j$ as correlation of musical preference of $j$-th artist to some political orientation, and $x_{ij}$ as $i$-th users preference for $j$-th artist, where $x_{ij} = 1$ for preference and $x_{ij} = -1$ for dislike. You can define your final estimate as

$$ \bar r_i = \tanh^{-1} \left(\frac{\sum_{j=1}^K \tanh(r_j x_{ij})}{K} \right) $$

i.e. compute average correlation that inverts the signs for correlations accordingly for preferred and disliked artists. By applying such procedure you end up with the average "correlation" of users preference and political orientation, that as regular correlation ranges from $-1$ to $1$.

But...

Don't you think that all of this is an overkill for something that is basically a multiple regression problem? Instead all the weighting and averaging you could simply use weighted multiple regression (linear or logistic depending if you predict binary preference or degree off preference in either direction) where weights are based on sizes of subsamples. You would use musical preference for each artist as predictor. In the end you'll use user's preference to make predictions. This approach is simpler and more statistically elegant. It also applies relative weights to the artists while averaging the correlations doesn't correct for their relative "impact" on the final score. Moreover, regression takes into consideration the base rate (or default political orientation), while averaging correlations does not. Imagine that vast majority of the population prefers party $A$, this should make you less eager to predict $B$'s and regression accounts for that by including intercept. The only problem is multicollinearity but when averaging correlations you ignore it rather then dealing with it.


Bushman, B.J., & Wang, M.C. (1995). A procedure for combining sample correlation coefficients and vote counts to obtain an estimate and a confidence interval for the population correlation coefficient. Psychological Bulletin, 117(3), 530.

Corey, D.M., Dunlap, W.P., and Burke, M.J. (1998). Averaging Correlations: Expected Values and Bias in Combined Pearson rs and Fisher's z Transformations, The Journal of General Psychology, 125(3), 245-261.

replaced http://stackoverflow.com/ with https://stackoverflow.com/
Source Link
Loading
replaced http://mathoverflow.net/ with https://mathoverflow.net/
Source Link
Loading
replaced http://stats.stackexchange.com/ with https://stats.stackexchange.com/
Source Link
Loading
Bounty Ended with 50 reputation awarded by Chris Wilson
added 315 characters in body
Source Link
Tim
  • 141.1k
  • 26
  • 270
  • 512
Loading
added 807 characters in body
Source Link
Tim
  • 141.1k
  • 26
  • 270
  • 512
Loading
added 13 characters in body
Source Link
Tim
  • 141.1k
  • 26
  • 270
  • 512
Loading
deleted 126 characters in body
Source Link
Tim
  • 141.1k
  • 26
  • 270
  • 512
Loading
added 43 characters in body
Source Link
Tim
  • 141.1k
  • 26
  • 270
  • 512
Loading
added 379 characters in body
Source Link
Tim
  • 141.1k
  • 26
  • 270
  • 512
Loading
added 379 characters in body
Source Link
Tim
  • 141.1k
  • 26
  • 270
  • 512
Loading
added 379 characters in body
Source Link
Tim
  • 141.1k
  • 26
  • 270
  • 512
Loading
deleted 17 characters in body
Source Link
Tim
  • 141.1k
  • 26
  • 270
  • 512
Loading
Source Link
Tim
  • 141.1k
  • 26
  • 270
  • 512
Loading