Post Undeleted by whuber
Post Deleted by Srishti M
Bumped by Community user
refined the Question to make it clear and general
Source Link
Srishti M
  • 1.4k
  • 15
  • 31

What is the interpretation of thiscorrect way for correlation and auto correlation plot?

I want to check if a time series is independent or not. The time series are nonlinear, generated from a nonlinear dynamical system.

For this I am using the autocorrelation (AC). Autocorrelation referstrying to plot the correlation of a time series with its own pastauto and future values.

A time series is a collectioncross correlation of ordered random variables. I have two different time seriesthe bitstream that areis obtained from a non-linearnonlinear dynamical system denoted by variable phi and phit respectively.

The sample length of each time series is 5000.

Statistical test for independence :

Question 1:

In general, for checking if the samples of a time series are independent and identically distributed do we check for auto correlation (ACF) or cross-correlation (CCF)?

What is the value that tells us whether the sequence is independent?

Question 2: An example

The first plot is

CST = xcorr(xphit,xphi); 
AST = xcorr(xphi,xphi);

numeric

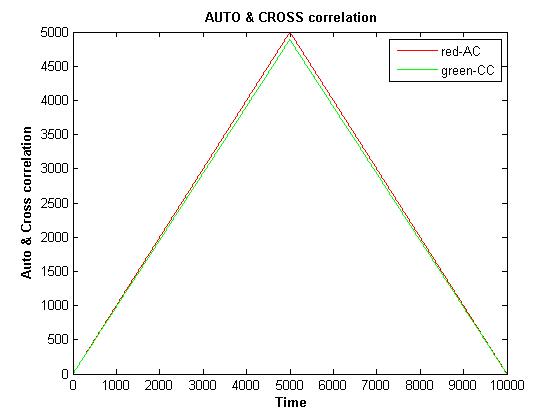
The secondThe graph is the Auto and cross-correlation for the bit streambitstream obtained from the same nonlinear dyanamical system.

bitstream

I am not sure how to interpret the two graphs, the spike at lag zero and whethergraph. Whether the samples are correlatedprogram is incorrect or independentnot. Please help

UPDATE: Here is the codeI wanted to generateobtain the plot usingof lags vs ACF but what I got is different than the actual plot given in a nonlinear dynamical systembook. Please help.

A = .5;  B = 1.99;  phin = .5;  xphi(1) = A - (B*phin);

for it = 2:1:5000    
 xphi(it) = A - (B*abs(xphi(it-1)));    
end
phi = 2*(xphi>=0.5)-1; 
A = .51;  B = 1.90;  phin = .5;  xphit(1) = A - (B*phin);

for it = 2:1:5000   
 xphit(it) = A - (B*abs(xphit(it-1)));    
end
phit = 2*(xphit>=0.5)-1; 


CST = xcorr(phit,phi);
AST = xcorr(phi,phi);

Time = 0;
for nn = 2:1:length(CST)
Time(nn) = Time(nn-1) + 1; 
end

plot(Time,AST,'r',Time,CST,'g');       title('\bf AUTO & CROSS correlation');    
xlabel('\bf Time');    ylabel('\bf Auto & Cross correlation'); legend('red-AC','green-CC');

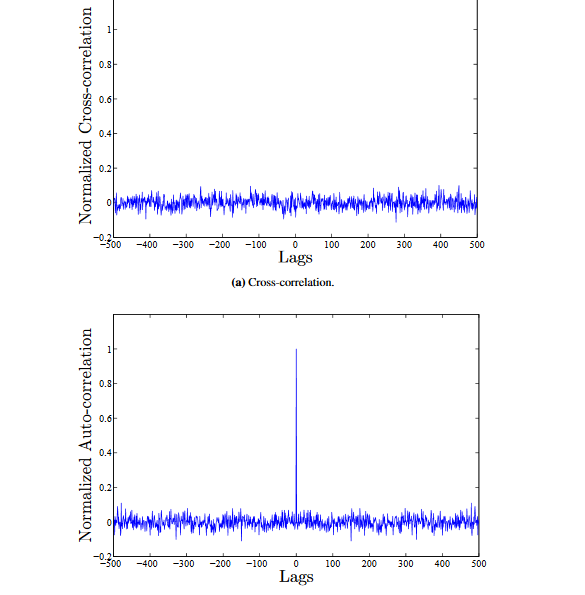
The plot should resemble

actual plot

where the figure on top is the cross-correlation and the bottom is the auto-correlation

What is the interpretation of this correlation and auto correlation plot?

I want to check if a time series is independent or not. The time series are nonlinear, generated from a nonlinear dynamical system.

For this I am using the autocorrelation (AC). Autocorrelation refers to the correlation of a time series with its own past and future values.

A time series is a collection of ordered random variables. I have two different time series that are obtained from a non-linear dynamical system denoted by variable phi and phit respectively.

The sample length of each time series is 5000.

Statistical test for independence :

Question 1:

In general, for checking if the samples of a time series are independent and identically distributed do we check for auto correlation (ACF) or cross-correlation (CCF)?

What is the value that tells us whether the sequence is independent?

Question 2: An example

The first plot is

CST = xcorr(xphit,xphi); AST = xcorr(xphi,xphi);

numeric

The second graph is the Auto and cross-correlation for the bit stream obtained from the same nonlinear dyanamical system.

bitstream

I am not sure how to interpret the two graphs, the spike at lag zero and whether the samples are correlated or independent. Please help

UPDATE: Here is the code to generate the plot using a nonlinear dynamical system.

A = .5;  B = 1.99;  phin = .5;  xphi(1) = A - (B*phin);

for it = 2:1:5000    
 xphi(it) = A - (B*abs(xphi(it-1)));    
end
phi = 2*(xphi>=0.5)-1; 
A = .51;  B = 1.90;  phin = .5;  xphit(1) = A - (B*phin);

for it = 2:1:5000   
 xphit(it) = A - (B*abs(xphit(it-1)));    
end
phit = 2*(xphit>=0.5)-1; 


CST = xcorr(phit,phi);
AST = xcorr(phi,phi);

Time = 0;
for nn = 2:1:length(CST)
Time(nn) = Time(nn-1) + 1; 
end

plot(Time,AST,'r',Time,CST,'g');       title('\bf AUTO & CROSS correlation');    
xlabel('\bf Time');    ylabel('\bf Auto & Cross correlation'); legend('red-AC','green-CC');

What is the correct way for correlation and auto correlation plot?

I am trying to plot the auto and cross correlation of the bitstream that is obtained from a nonlinear dynamical system. 
The graph is the Auto and cross-correlation for the bitstream obtained from the same nonlinear dyanamical system.

bitstream

I am not sure how to interpret the graph. Whether the program is incorrect or not. I wanted to obtain the plot of lags vs ACF but what I got is different than the actual plot given in a book. Please help.

A = .5;  B = 1.99;  phin = .5;  xphi(1) = A - (B*phin);

for it = 2:1:5000    
 xphi(it) = A - (B*abs(xphi(it-1)));    
end
phi = 2*(xphi>=0.5)-1; 
A = .51;  B = 1.90;  phin = .5;  xphit(1) = A - (B*phin);

for it = 2:1:5000   
 xphit(it) = A - (B*abs(xphit(it-1)));    
end
phit = 2*(xphit>=0.5)-1; 


CST = xcorr(phit,phi);
AST = xcorr(phi,phi);

Time = 0;
for nn = 2:1:length(CST)
Time(nn) = Time(nn-1) + 1; 
end

plot(Time,AST,'r',Time,CST,'g');       title('\bf AUTO & CROSS correlation');    
xlabel('\bf Time');    ylabel('\bf Auto & Cross correlation'); legend('red-AC','green-CC');

The plot should resemble

actual plot

where the figure on top is the cross-correlation and the bottom is the auto-correlation

refined the Question to make it clear and general
Source Link
Srishti M
  • 1.4k
  • 15
  • 31

I want to check if a time series is independent or not. The time series are nonlinear, generated from a nonlinear dynamical system. Following the paper titled : A New Pseudo-Random Number Generator Based on Two Chaotic Maps

I am learning what techniques are there to show if a system such as the one above, known as chaotic nonlinear dynamical system from which the time series is obtained can be a good generator of PRBS. I am following the tests given in paper :

For this I am using the autocorrelation (AC). Autocorrelation refers to the correlation of a time series with its own past and future values.

A sequencetime series is a collection of samples andordered random variables. I treat this as ahave two different time series that are obtained from a non-denotedlinear dynamical system denoted by variablesvariable phi and phit respectively.

The sample length of each time series is 5000.

Statistical test for independence :

Question 1:

In general, for checking if the samples of a time series are independent and identically distributed do we check for auto correlation (ACF) or cross-correlation (CCF)?

Considering one time series only, if I want to check for independence then auto correlation should be zero.

Is this wrongWhat is the value that tells us whether the sequence is independent?

Question 2: An example

The first plot is

CST = xcorr(xphit,xphi); AST = xcorr(xphi,xphi);

numeric

The second graph is the Auto and cross-correlation for the bitstreambit stream obtained from the same nonlinear dyanamical system.

bitstream

I am not sure how to interpret the two graphs, the spike at lag zero and whether the samples are correlated or independent. Please help

UPDATE: Here is the code to generate the plot. As I cannot upload the data set, I am using a simulated data set using a nonlinear dynamical system.

A = .5;  B = 1.99;  phin = .5;  xphi(1) = A - (B*phin);

for it = 2:1:5000    
 xphi(it) = A - (B*abs(xphi(it-1)));    
end
phi = 2*(xphi>=0.5)-1; 
A = .51;  B = 1.90;  phin = .5;  xphit(1) = A - (B*phin);

for it = 2:1:5000   
 xphit(it) = A - (B*abs(xphit(it-1)));    
end
phit = 2*(xphit>=0.5)-1; 


CST = xcorr(phit,phi);
AST = xcorr(phi,phi);

Time = 0;
for nn = 2:1:length(CST)
Time(nn) = Time(nn-1) + 1; 
end

plot(Time,AST,'r',Time,CST,'g');       title('\bf AUTO & CROSS correlation');    
xlabel('\bf Time');    ylabel('\bf Auto & Cross correlation'); legend('red-AC','green-CC');

I want to check if a time series is independent or not. The time series are nonlinear, generated from a nonlinear dynamical system. Following the paper titled : A New Pseudo-Random Number Generator Based on Two Chaotic Maps

I am learning what techniques are there to show if a system such as the one above, known as chaotic nonlinear dynamical system from which the time series is obtained can be a good generator of PRBS. I am following the tests given in paper :

For this I am using the autocorrelation (AC). Autocorrelation refers to the correlation of a time series with its own past and future values.

A sequence of samples and I treat this as a time series -denoted by variables phi and phit respectively.

The sample length of each time series is 5000.

Statistical test for independence :

Question 1:

In general, for checking if the samples of a time series are independent and identically distributed do we check for auto correlation or cross-correlation?

Considering one time series only, if I want to check for independence then auto correlation should be zero.

Is this wrong?

Question 2:

The first plot is

CST = xcorr(xphit,xphi); AST = xcorr(xphi,xphi);

numeric

The second graph is the Auto and cross-correlation for the bitstream obtained from the same nonlinear dyanamical system.

bitstream

I am not sure how to interpret the two graphs.

UPDATE: Here is the code to generate the plot. As I cannot upload the data set, I am using a simulated data set using a nonlinear dynamical system.

A = .5;  B = 1.99;  phin = .5;  xphi(1) = A - (B*phin);

for it = 2:1:5000    
 xphi(it) = A - (B*abs(xphi(it-1)));    
end
phi = 2*(xphi>=0.5)-1; 
A = .51;  B = 1.90;  phin = .5;  xphit(1) = A - (B*phin);

for it = 2:1:5000   
 xphit(it) = A - (B*abs(xphit(it-1)));    
end
phit = 2*(xphit>=0.5)-1; 


CST = xcorr(phit,phi);
AST = xcorr(phi,phi);

Time = 0;
for nn = 2:1:length(CST)
Time(nn) = Time(nn-1) + 1; 
end

plot(Time,AST,'r',Time,CST,'g');       title('\bf AUTO & CROSS correlation');    
xlabel('\bf Time');    ylabel('\bf Auto & Cross correlation'); legend('red-AC','green-CC');

I want to check if a time series is independent or not. The time series are nonlinear, generated from a nonlinear dynamical system.

For this I am using the autocorrelation (AC). Autocorrelation refers to the correlation of a time series with its own past and future values.

A time series is a collection of ordered random variables. I have two different time series that are obtained from a non-linear dynamical system denoted by variable phi and phit respectively.

The sample length of each time series is 5000.

Statistical test for independence :

Question 1:

In general, for checking if the samples of a time series are independent and identically distributed do we check for auto correlation (ACF) or cross-correlation (CCF)?

What is the value that tells us whether the sequence is independent?

Question 2: An example

The first plot is

CST = xcorr(xphit,xphi); AST = xcorr(xphi,xphi);

numeric

The second graph is the Auto and cross-correlation for the bit stream obtained from the same nonlinear dyanamical system.

bitstream

I am not sure how to interpret the two graphs, the spike at lag zero and whether the samples are correlated or independent. Please help

UPDATE: Here is the code to generate the plot using a nonlinear dynamical system.

A = .5;  B = 1.99;  phin = .5;  xphi(1) = A - (B*phin);

for it = 2:1:5000    
 xphi(it) = A - (B*abs(xphi(it-1)));    
end
phi = 2*(xphi>=0.5)-1; 
A = .51;  B = 1.90;  phin = .5;  xphit(1) = A - (B*phin);

for it = 2:1:5000   
 xphit(it) = A - (B*abs(xphit(it-1)));    
end
phit = 2*(xphit>=0.5)-1; 


CST = xcorr(phit,phi);
AST = xcorr(phi,phi);

Time = 0;
for nn = 2:1:length(CST)
Time(nn) = Time(nn-1) + 1; 
end

plot(Time,AST,'r',Time,CST,'g');       title('\bf AUTO & CROSS correlation');    
xlabel('\bf Time');    ylabel('\bf Auto & Cross correlation'); legend('red-AC','green-CC');
refined the Question to make it clear and general
Source Link
Srishti M
  • 1.4k
  • 15
  • 31

I want to check if a time series is (a) randomindependent or not (b) independent. The time series are nonlinear, generated from a nonlinear dynamical system. Following the paper titled : A New Pseudo-Random Number Generator Based on Two Chaotic Maps

For thesethis I am using the autocorrelation (AC). Autocorrelation refers to the correlation of a time series with its own past and future values.

If random variables are independent then there should be no correlation between them. The reverse is not true.

The sample length of each time series is 5000. I have plotted

Statistical test for independence :

Question 1:

In general, for checking if the ACsamples of a time series are independent and identically distributed do we check for auto correlation or cross-correlation?

Considering one time series phi.only, if I cannot interpret the graphwant to check for independence then auto correlation should be zero.

Is this wrong?

Question 2:

The first plot is

CST = xcorr(xphit, whatxphi); AST = xcorr(xphi,xphi);

numeric

The second graph is the spike indicatesAuto and ifcross-correlation for the graph provides information about randomness and independencebitstream obtained from the same nonlinear dyanamical system.

resulbitstream

I am not sure what statistical tests I should be performinghow to check for randomness and independenceinterpret the two graphs.

A = .5;  B = 1.99;  phin = .5;  xphi(1) = A - (B*phin);

for it = 2:1:5000    
 xphi(it) = A - (B*abs(xphi(it-1)));    
end
phi = 2*(xphi>=0.5)-1; 
A = .51;  B = 1.90;  phin = .5;  xphit(1) = A - (B*phin);

for it = 2:1:5000   
 xphit(it) = A - (B*abs(xphit(it-1)));    
end
phit = 2*(xphit>=0.5)-1; 


CST = xcorr(phit,xphiphi);
AST = xcorr(xphiphi,xphiphi);

Time = 0;
for nn = 2:1:length(CST)
Time(nn) = Time(nn-1) + 1; 
end

plot(Time,AST,'r',Time,CST,'g');       title('\bf AUTO & CROSS correlation');    
xlabel('\bf Time');    ylabel('\bf Auto & Cross correlation'); legend('red-AC','green-CC');

I want to check if a time series is (a) random or not (b) independent. The time series are nonlinear, generated from a nonlinear dynamical system. Following the paper titled : A New Pseudo-Random Number Generator Based on Two Chaotic Maps

For these I am using the autocorrelation (AC). Autocorrelation refers to the correlation of a time series with its own past and future values.

If random variables are independent then there should be no correlation between them. The reverse is not true.

The sample length of each time series is 5000. I have plotted the AC for time series phi. I cannot interpret the graph, what the spike indicates and if the graph provides information about randomness and independence.

resul

I am not sure what statistical tests I should be performing to check for randomness and independence.

A = .5;  B = 1.99;  phin = .5;  xphi(1) = A - (B*phin);

for it = 2:1:5000    
 xphi(it) = A - (B*abs(xphi(it-1)));    
end
phi = 2*(xphi>=0.5)-1; 
A = .51;  B = 1.90;  phin = .5;  xphit(1) = A - (B*phin);

for it = 2:1:5000   
 xphit(it) = A - (B*abs(xphit(it-1)));    
end
phit = 2*(xphit>=0.5)-1; 


CST = xcorr(phit,xphi);
AST = xcorr(xphi,xphi);

Time = 0;
for nn = 2:1:length(CST)
Time(nn) = Time(nn-1) + 1; 
end

plot(Time,AST,'r',Time,CST,'g');       title('\bf AUTO & CROSS correlation');    
xlabel('\bf Time');    ylabel('\bf Auto & Cross correlation'); legend('red-AC','green-CC');

I want to check if a time series is independent or not. The time series are nonlinear, generated from a nonlinear dynamical system. Following the paper titled : A New Pseudo-Random Number Generator Based on Two Chaotic Maps

For this I am using the autocorrelation (AC). Autocorrelation refers to the correlation of a time series with its own past and future values.

The sample length of each time series is 5000.

Statistical test for independence :

Question 1:

In general, for checking if the samples of a time series are independent and identically distributed do we check for auto correlation or cross-correlation?

Considering one time series only, if I want to check for independence then auto correlation should be zero.

Is this wrong?

Question 2:

The first plot is

CST = xcorr(xphit,xphi); AST = xcorr(xphi,xphi);

numeric

The second graph is the Auto and cross-correlation for the bitstream obtained from the same nonlinear dyanamical system.

bitstream

I am not sure how to interpret the two graphs.

A = .5;  B = 1.99;  phin = .5;  xphi(1) = A - (B*phin);

for it = 2:1:5000    
 xphi(it) = A - (B*abs(xphi(it-1)));    
end
phi = 2*(xphi>=0.5)-1; 
A = .51;  B = 1.90;  phin = .5;  xphit(1) = A - (B*phin);

for it = 2:1:5000   
 xphit(it) = A - (B*abs(xphit(it-1)));    
end
phit = 2*(xphit>=0.5)-1; 


CST = xcorr(phit,phi);
AST = xcorr(phi,phi);

Time = 0;
for nn = 2:1:length(CST)
Time(nn) = Time(nn-1) + 1; 
end

plot(Time,AST,'r',Time,CST,'g');       title('\bf AUTO & CROSS correlation');    
xlabel('\bf Time');    ylabel('\bf Auto & Cross correlation'); legend('red-AC','green-CC');
Tweeted twitter.com/StackStats/status/771434500102430724
updated Question, provided more details
Source Link
Srishti M
  • 1.4k
  • 15
  • 31
Loading
updated Question, provided more details
Source Link
Srishti M
  • 1.4k
  • 15
  • 31
Loading
Source Link
Srishti M
  • 1.4k
  • 15
  • 31
Loading