deleted 3 characters in body
Source Link
kjetil b halvorsen
  • 82.8k
  • 32
  • 201
  • 663

I'm trying to curve fit a functional form to observed data - where my observed data is a physical observation that represents a CDF.

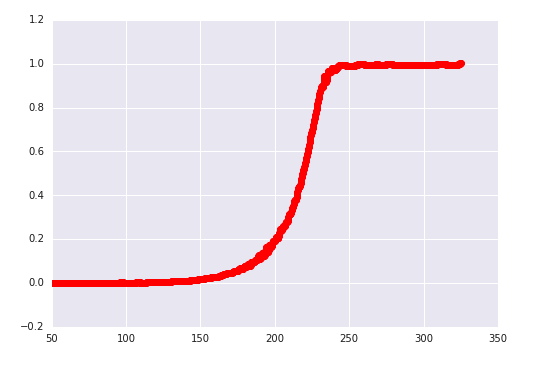
Visually - my data points currently look like this:

y_spl_2d = y_spl.derivative(n=1)
plt.plot(x_range,y_spl_2d(x_range), 'ro')

enter image description here

My goal is to get an accurate representation of the PDF. Just a visual inspection of the CDF looks good (I know... not that that means much).

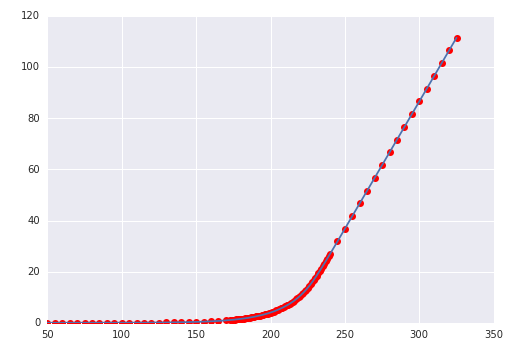
If I take the second derivative of this function numerically there is TONS of noise introduced. This is what it looks like:

enter image description here

This is where I'm at. Can I fit a functional form to this CDF data so I can take a derivative symbolically?

What is the best way - in a statistical sense - to not lose information like bi-modal PDFs and other things like this. How can I include enough paramtersparameters in my functional form to include skewness, kurtosis, etc (to not force a perfectly guassianGaussian distribution)?

The original fit where all of this data derives from is the derivative of an options price to the strike.   

enter image description here

I'm trying to curve fit a functional form to observed data - where my observed data is a physical observation that represents a CDF.

Visually - my data points currently look like this:

y_spl_2d = y_spl.derivative(n=1)
plt.plot(x_range,y_spl_2d(x_range), 'ro')

enter image description here

My goal is to get an accurate representation of the PDF. Just a visual inspection of the CDF looks good (I know... not that that means much).

If I take the second derivative of this function numerically there is TONS of noise introduced. This is what it looks like:

enter image description here

This is where I'm at. Can I fit a functional form to this CDF data so I can take a derivative symbolically?

What is the best way - in a statistical sense - to not lose information like bi-modal PDFs and other things like this. How can I include enough paramters in my functional form to include skewness, kurtosis, etc (to not force a perfectly guassian distribution)?

The original fit where all of this data derives from is the derivative of an options price to the strike.  enter image description here
I'm trying to curve fit a functional form to observed data - where my observed data is a physical observation that represents a CDF.

Visually - my data points currently look like this:

y_spl_2d = y_spl.derivative(n=1)
plt.plot(x_range,y_spl_2d(x_range), 'ro')

enter image description here

My goal is to get an accurate representation of the PDF. Just a visual inspection of the CDF looks good (I know... not that that means much).

If I take the second derivative of this function numerically there is TONS of noise introduced. This is what it looks like:

enter image description here

This is where I'm at. Can I fit a functional form to this CDF data so I can take a derivative symbolically?

What is the best way - in a statistical sense - to not lose information like bi-modal PDFs and other things like this. How can I include enough parameters in my functional form to include skewness, kurtosis, etc (to not force a perfectly Gaussian distribution)?

The original fit where all of this data derives from is the derivative of an options price to the strike. 

enter image description here

added 198 characters in body
Source Link
Jared
  • 111
  • 4

I'm trying to curve fit a functional form to observed data - where my observed data is a physical observation that represents a CDF.

Visually - my data points currently look like this:

y_spl_2d = y_spl.derivative(n=1)
plt.plot(x_range,y_spl_2d(x_range), 'ro')

enter image description here

My goal is to get an accurate representation of the PDF. Just a visual inspection of the CDF looks good (I know... not that that means much).

If I take the second derivative of this function numerically there is TONS of noise introduced. This is what it looks like:

enter image description here

This is where I'm at. Can I fit a functional form to this CDF data so I can take a derivative symbolically?

What is the best way - in a statistical sense - to not lose information like bi-modal PDFs and other things like this. How can I include enough paramters in my functional form to include skewness, kurtosis, etc (to not force a perfectly guassian distribution)?

The original fit where all of this data derives from is the derivative of an options price to the strike. enter image description here
I'm trying to curve fit a functional form to observed data - where my observed data is a physical observation that represents a CDF.

Visually - my data points currently look like this:

y_spl_2d = y_spl.derivative(n=1)
plt.plot(x_range,y_spl_2d(x_range), 'ro')

enter image description here

My goal is to get an accurate representation of the PDF. Just a visual inspection of the CDF looks good (I know... not that that means much).

If I take the second derivative of this function numerically there is TONS of noise introduced. This is what it looks like:

enter image description here

This is where I'm at. Can I fit a functional form to this CDF data so I can take a derivative symbolically?

What is the best way - in a statistical sense - to not lose information like bi-modal PDFs and other things like this. How can I include enough paramters in my functional form to include skewness, kurtosis, etc (to not force a perfectly guassian distribution)?

The original fit where all of this data derives from is the derivative of an options price to the strike. enter image description here

Source Link
Jared
  • 111
  • 4

Fitting a CDF to differentiate symbolically

I'm trying to curve fit a functional form to observed data - where my observed data is a physical observation that represents a CDF.

Visually - my data points currently look like this:

y_spl_2d = y_spl.derivative(n=1)
plt.plot(x_range,y_spl_2d(x_range), 'ro')

enter image description here

My goal is to get an accurate representation of the PDF. Just a visual inspection of the CDF looks good (I know... not that that means much).

If I take the second derivative of this function numerically there is TONS of noise introduced. This is what it looks like:

enter image description here

This is where I'm at. Can I fit a functional form to this CDF data so I can take a derivative symbolically?

What is the best way - in a statistical sense - to not lose information like bi-modal PDFs and other things like this. How can I include enough paramters in my functional form to include skewness, kurtosis, etc (to not force a perfectly guassian distribution)?