Bumped by Community user
edited tags
Link
kjetil b halvorsen
  • 82.8k
  • 32
  • 201
  • 663
added 115 characters in body
Source Link
whuber
  • 333.7k
  • 63
  • 792
  • 1.3k

My question: Is there a formula to calculate analytically the expected number of "exceptions" which the simulator generates, as explained in the passage below?

For most of my adult life I've been explaining to people that "exceptions," meaning examples running counter to the trend, do not disprove claims that there's a correlation between two variables.

For most of my adult life I've been explaining to people that "exceptions," meaning examples running counter to the trend, do not disprove claims that there's a correlation between two variables.

To get a good idea of the percentage of examples which will be "exceptions" to a correlation, check out thisthe correlation simulator at rlanders.net/correlation.html.

Image

For a positive correlation, the "exceptions" are the dots in the upper left and lower right quadrants. As the correlation coefficient is set to higher values, the number of exceptions will tend to decrease. But, as is easily seen, even at high values there are more "exceptions" than you may think.

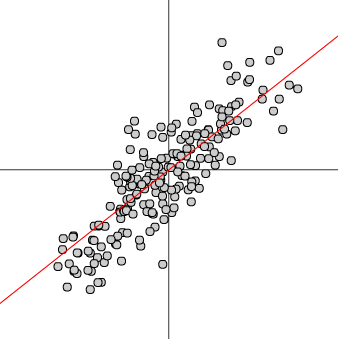
http://rlanders.net/correlation.html

My question: Is there a formula to calculate analytically the expected number of "exceptions" which the simulator generates, as explained in the passage below?

For most of my adult life I've been explaining to people that "exceptions," meaning examples running counter to the trend, do not disprove claims that there's a correlation between two variables.

To get a good idea of the percentage of examples which will be "exceptions" to a correlation, check out this correlation simulator. For a positive correlation, the "exceptions" are the dots in the upper left and lower right quadrants. As the correlation coefficient is set to higher values, the number of exceptions will tend to decrease. But, as is easily seen, even at high values there are more "exceptions" than you may think.

http://rlanders.net/correlation.html

My question: Is there a formula to calculate analytically the expected number of "exceptions" which the simulator generates, as explained in the passage below?

For most of my adult life I've been explaining to people that "exceptions," meaning examples running counter to the trend, do not disprove claims that there's a correlation between two variables.

To get a good idea of the percentage of examples which will be "exceptions" to a correlation, check out the correlation simulator at rlanders.net/correlation.html.

Image

For a positive correlation, the "exceptions" are the dots in the upper left and lower right quadrants. As the correlation coefficient is set to higher values, the number of exceptions will tend to decrease. But, as is easily seen, even at high values there are more "exceptions" than you may think.

Source Link

Calculate number of "exceptions" to correlation

My question: Is there a formula to calculate analytically the expected number of "exceptions" which the simulator generates, as explained in the passage below?

For most of my adult life I've been explaining to people that "exceptions," meaning examples running counter to the trend, do not disprove claims that there's a correlation between two variables.

To get a good idea of the percentage of examples which will be "exceptions" to a correlation, check out this correlation simulator. For a positive correlation, the "exceptions" are the dots in the upper left and lower right quadrants. As the correlation coefficient is set to higher values, the number of exceptions will tend to decrease. But, as is easily seen, even at high values there are more "exceptions" than you may think.

http://rlanders.net/correlation.html