deleted 100 characters in body
Source Link
Glen_b
  • 290.5k
  • 37
  • 652
  • 1.1k

You're referring to a transformation from a pair of independent variates $(X,Y)$ to the polar representation $(R,\theta)$ (radius and angle), and then looking at the marginal distribution of $\theta$.

I'm going to offer a somewhat intuitive explanation (though a mathematical derivation of the density does essentially what I describe informally).

Note that if you scale the two variables, X and Y by some common scale (e.g. go from U(-1,1) to U(-10,10) or from N(0,1) to N(0,20) on both variables at the same time) that makes no difference to the distribution of the angle (it only affects the scale of the distribution of the radius). So let's just consider the unit cases.

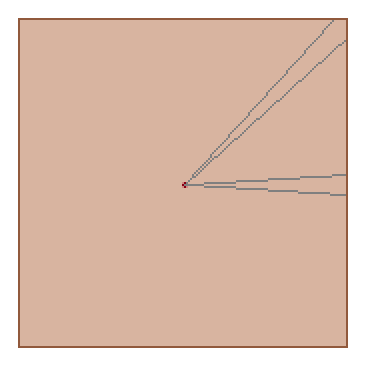
First consider what's going on with the uniform case. Note that the distribution is uniform over the unit square, so that the probability density in a region that's contained within $[-1,1]^2$ is proportional to the area of the region. Specifically, look at the density associated with an element of angle, $d\theta$ near the horizontal (near angle $\theta=0$) and on the diagonal (near angle $\theta=\pi/4$):

enter image description here

Clearly the probability element $df_\theta$ (i.e. area) corresponding to an element of angle ($d\theta$) is larger when the angle is near one of the diagonals. Indeed consider inscribing a circle inside the square; the area spanned by a given tiny angle within the circle is constant, and then the part outside the circle grows as we approach the diagonal, where it at its maximum.

This completely accounts for the pattern you see in the simulations.

Indeed, we can see that the density must be proportional to the length of the segment from the center of the square to its edge; simple trigonometry is sufficient to derive the density from there (e.g. up to the first diagonal at $\pi/4$ the density will be proportional to $\sec(\theta)$, and from therethen it's easy to find the constant required to make the density integrate to 1.

[Edit: added this next bit to discuss the radius, since the question has changed since my original answer.]

Note that if we had a uniform distribution over the unit circle (i.e. the one we inscribed in the square before) then the density of the radius for that would be proportional to the radius (consider the area of a small annular element of width $dr$ at radius $r$ - i.e. between $r$ and $r+dr$ - has area proportional to $r$). Then as we pass outside the circle, new annular regions with larger radius only get density contributions from the part in the square, so the density decreases (initially quite rapidly, then more slowly) between $1$ and $\sqrt 2$. (Again, fairly simple geometrical notions are sufficient to get the functional form of the density if it is needed.)


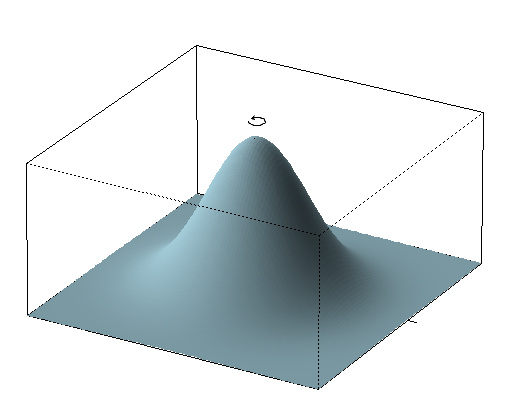
By contrast, if the joint distribution is rotationally symmetric about the origin then the probability element at some angle doesn't depend on the angle (this is essentially a tautology!). The bivariate distribution of two independent standard Gaussians is rotationally symmetric about the origin:

enter image description here

(code for this image based on Elan Cohen's code here but there's a nice alternative here, and something between the two here)

Consequently the volume contained in some angle $d\theta$ is the same for every $\theta$, so the density associated with the angle is uniform on $[0,2\pi)$.

[The polar trick typically used for integrating the normal density over the real line can be used to figure out that the density of the squared radius is negative exponential, and from there the density of the radius is simple to identify by a simple transformation argument from the distribution function]

You're referring to a transformation from a pair of independent variates $(X,Y)$ to the polar representation $(R,\theta)$ (radius and angle), and then looking at the marginal distribution of $\theta$.

I'm going to offer a somewhat intuitive explanation (though a mathematical derivation of the density does essentially what I describe informally).

Note that if you scale the two variables, X and Y by some common scale (e.g. go from U(-1,1) to U(-10,10) or from N(0,1) to N(0,20) on both variables at the same time) that makes no difference to the distribution of the angle (it only affects the scale of the distribution of the radius). So let's just consider the unit cases.

First consider what's going on with the uniform case. Note that the distribution is uniform over the unit square, so that the probability density in a region that's contained within $[-1,1]^2$ is proportional to the area of the region. Specifically, look at the density associated with an element of angle, $d\theta$ near the horizontal (near angle $\theta=0$) and on the diagonal (near angle $\theta=\pi/4$):

enter image description here

Clearly the probability element $df_\theta$ (i.e. area) corresponding to an element of angle ($d\theta$) is larger when the angle is near one of the diagonals. Indeed consider inscribing a circle inside the square; the area spanned by a given tiny angle within the circle is constant, and then the part outside the circle grows as we approach the diagonal, where it at its maximum.

This completely accounts for the pattern you see in the simulations.

Indeed, we can see that the density must be proportional to the length of the segment from the center of the square to its edge; simple trigonometry is sufficient to derive the density from there (e.g. up to the first diagonal at $\pi/4$ the density will be proportional to $\sec(\theta)$, and from there it's easy to find the constant required to make the density integrate to 1.

[Edit: added this next bit to discuss the radius, since the question has changed since my original answer.]

Note that if we had a uniform distribution over the unit circle (i.e. the one we inscribed in the square before) then the density of the radius for that would be proportional to the radius (consider the area of a small annular element of width $dr$ at radius $r$ - i.e. between $r$ and $r+dr$ - has area proportional to $r$). Then as we pass outside the circle, new annular regions with larger radius only get density contributions from the part in the square, so the density decreases (initially quite rapidly, then more slowly) between $1$ and $\sqrt 2$. (Again, fairly simple geometrical notions are sufficient to get the functional form of the density if it is needed.)


By contrast, if the joint distribution is rotationally symmetric about the origin then the probability element at some angle doesn't depend on the angle (this is essentially a tautology!). The bivariate distribution of two independent standard Gaussians is rotationally symmetric about the origin:

enter image description here

(code for this image based on Elan Cohen's code here but there's a nice alternative here, and something between the two here)

Consequently the volume contained in some angle $d\theta$ is the same for every $\theta$, so the density associated with the angle is uniform on $[0,2\pi)$.

[The polar trick typically used for integrating the normal density over the real line can be used to figure out that the density of the squared radius is negative exponential, and from there the density of the radius is simple to identify by a simple transformation argument from the distribution function]
You're referring to a transformation from a pair of independent variates $(X,Y)$ to the polar representation $(R,\theta)$ (radius and angle), and then looking at the marginal distribution of $\theta$.

I'm going to offer a somewhat intuitive explanation (though a mathematical derivation of the density does essentially what I describe informally).

Note that if you scale the two variables, X and Y by some common scale (e.g. go from U(-1,1) to U(-10,10) or from N(0,1) to N(0,20) on both variables at the same time) that makes no difference to the distribution of the angle (it only affects the scale of the distribution of the radius). So let's just consider the unit cases.

First consider what's going on with the uniform case. Note that the distribution is uniform over the unit square, so that the probability density in a region that's contained within $[-1,1]^2$ is proportional to the area of the region. Specifically, look at the density associated with an element of angle, $d\theta$ near the horizontal (near angle $\theta=0$) and on the diagonal (near angle $\theta=\pi/4$):

enter image description here

Clearly the probability element $df_\theta$ (i.e. area) corresponding to an element of angle ($d\theta$) is larger when the angle is near one of the diagonals. Indeed consider inscribing a circle inside the square; the area spanned by a given tiny angle within the circle is constant, and then the part outside the circle grows as we approach the diagonal, where it at its maximum.

This completely accounts for the pattern you see in the simulations.

Indeed, we can see that the density must be proportional to the length of the segment from the center of the square to its edge; simple trigonometry is sufficient to derive the density from there and then it's easy to find the constant required to make the density integrate to 1.

[Edit: added this next bit to discuss the radius, since the question has changed since my original answer.]

Note that if we had a uniform distribution over the unit circle (i.e. the one we inscribed in the square before) then the density of the radius for that would be proportional to the radius (consider the area of a small annular element of width $dr$ at radius $r$ - i.e. between $r$ and $r+dr$ - has area proportional to $r$). Then as we pass outside the circle, new annular regions with larger radius only get density contributions from the part in the square, so the density decreases (initially quite rapidly, then more slowly) between $1$ and $\sqrt 2$. (Again, fairly simple geometrical notions are sufficient to get the functional form of the density if it is needed.)


By contrast, if the joint distribution is rotationally symmetric about the origin then the probability element at some angle doesn't depend on the angle (this is essentially a tautology!). The bivariate distribution of two independent standard Gaussians is rotationally symmetric about the origin:

enter image description here

(code for this image based on Elan Cohen's code here but there's a nice alternative here, and something between the two here)

Consequently the volume contained in some angle $d\theta$ is the same for every $\theta$, so the density associated with the angle is uniform on $[0,2\pi)$.

[The polar trick typically used for integrating the normal density over the real line can be used to figure out that the density of the squared radius is negative exponential, and from there the density of the radius is simple to identify by a simple transformation argument from the distribution function]

added 2 characters in body
Source Link
Glen_b
  • 290.5k
  • 37
  • 652
  • 1.1k

You're referring to a transformation from a pair of independent variates $(X,Y)$ to the polar representation $(R,\theta)$ (radius and angle), and then looking at the marginal distribution of $\theta$.

I'm going to offer a somewhat intuitive explanation (though a mathematical derivation of the density does essentially what I describe informally).

Note that if you scale the two variables, X and Y by some common scale (e.g. go from U(-1,1) to U(-10,10) or from N(0,1) to N(0,20) on both variables at the same time) that makes no difference to the distribution of the angle (it only affects the scale of the distribution of the radius). So let's just consider the unit cases.

First consider what's going on with the uniform case. Note that the distribution is uniform over the unit square, so that the probability density in a region that's contained within $[-1,1]^2$ is proportional to the area of the region. Specifically, look at the density associated with an element of angle, $d\theta$ near the horizontal (near angle $\theta=0$) and on the diagonal (near angle $\theta=\pi/4$):

enter image description here

Clearly the probability element $df_\theta$ (i.e. area) corresponding to an element of angle ($d\theta$) is larger when the angle is near one of the diagonals. Indeed consider inscribing a circle inside the square; the area spanned by a given tiny angle within the circle is constant, and then the part outside the circle grows as we approach the diagonal, where it at its maximum.

This completely accounts for the pattern you see in the simulations.

Indeed, we can see that the density must be proportional to the length of the segment from the center of the square to its edge; simple trigonometry is sufficient to derive the density from there (e.g. up to the first diagonal at $\pi/4$ the density will be proportional to $\sec(\theta)$, and from there it's easy to find the constant required to make the density integrate to 1.

[Edit: added this next bit to discuss the radius, since the question has changed since my original answer.]

Note that if we had a uniform distribution over the unit circle (i.e. the one we inscribed in the square before) then the density of the radius for that would be proportional to the radius (consider the area of a small annular element of width $dr$ at radius $r$ - i.e. between $r$ and $r+dr$ - has area proportional to $r$). Then as we pass outside the circle, new annular regions with larger radius only get density contributions from the part in the square, so the density decreases (initially quite rapidly, then more slowly) between $1$ and $\sqrt 2$. (Again, fairly simple geometrical notions are sufficient to get the functional form of the density if it is needed.)


By contrast, if the joint distribution is rationallyrotationally symmetric about the origin then the probability element at some angle doesn't depend on the angle (this is essentially a tautology!). The bivariate distribution of two independent standard Gaussians is rotationally symmetric about the origin:

enter image description here

(code for this image based on Elan Cohen's code here but there's a nice alternative here, and something between the two here)

Consequently the volume contained in some angle $d\theta$ is the same for every $\theta$, so the density associated with the angle is uniform on $[0,2\pi)$.

[The polar trick typically used for integrating the normal density over the real line can be used to figure out that the density of the squared radius is negative exponential, and from there the density of the radius is simple to identify by a simple transformation argument from the distribution function]

You're referring to a transformation from a pair of independent variates $(X,Y)$ to the polar representation $(R,\theta)$ (radius and angle), and then looking at the marginal distribution of $\theta$.

I'm going to offer a somewhat intuitive explanation (though a mathematical derivation of the density does essentially what I describe informally).

Note that if you scale the two variables, X and Y by some common scale (e.g. go from U(-1,1) to U(-10,10) or from N(0,1) to N(0,20) on both variables at the same time) that makes no difference to the distribution of the angle (it only affects the scale of the distribution of the radius). So let's just consider the unit cases.

First consider what's going on with the uniform case. Note that the distribution is uniform over the unit square, so that the probability density in a region that's contained within $[-1,1]^2$ is proportional to the area of the region. Specifically, look at the density associated with an element of angle, $d\theta$ near the horizontal (near angle $\theta=0$) and on the diagonal (near angle $\theta=\pi/4$):

enter image description here

Clearly the probability element $df_\theta$ (i.e. area) corresponding to an element of angle ($d\theta$) is larger when the angle is near one of the diagonals. Indeed consider inscribing a circle inside the square; the area spanned by a given tiny angle within the circle is constant, and then the part outside the circle grows as we approach the diagonal, where it at its maximum.

This completely accounts for the pattern you see in the simulations.

Indeed, we can see that the density must be proportional to the length of the segment from the center of the square to its edge; simple trigonometry is sufficient to derive the density from there (e.g. up to the first diagonal at $\pi/4$ the density will be proportional to $\sec(\theta)$, and from there it's easy to find the constant required to make the density integrate to 1.

[Edit: added this next bit to discuss the radius, since the question has changed since my original answer.]

Note that if we had a uniform distribution over the unit circle (i.e. the one we inscribed in the square before) then the density of the radius for that would be proportional to the radius (consider the area of a small annular element of width $dr$ at radius $r$ - i.e. between $r$ and $r+dr$ - has area proportional to $r$). Then as we pass outside the circle, new annular regions with larger radius only get density contributions from the part in the square, so the density decreases (initially quite rapidly, then more slowly) between $1$ and $\sqrt 2$. (Again, fairly simple geometrical notions are sufficient to get the functional form of the density if it is needed.)


By contrast, if the joint distribution is rationally symmetric about the origin then the probability element at some angle doesn't depend on the angle (this is essentially a tautology!). The bivariate distribution of two independent standard Gaussians is rotationally symmetric about the origin:

enter image description here

(code for this image based on Elan Cohen's code here but there's a nice alternative here, and something between the two here)

Consequently the volume contained in some angle $d\theta$ is the same for every $\theta$, so the density associated with the angle is uniform on $[0,2\pi)$.

[The polar trick typically used for integrating the normal density over the real line can be used to figure out that the density of the squared radius is negative exponential, and from there the density of the radius is simple to identify by a simple transformation argument from the distribution function]

You're referring to a transformation from a pair of independent variates $(X,Y)$ to the polar representation $(R,\theta)$ (radius and angle), and then looking at the marginal distribution of $\theta$.

I'm going to offer a somewhat intuitive explanation (though a mathematical derivation of the density does essentially what I describe informally).

Note that if you scale the two variables, X and Y by some common scale (e.g. go from U(-1,1) to U(-10,10) or from N(0,1) to N(0,20) on both variables at the same time) that makes no difference to the distribution of the angle (it only affects the scale of the distribution of the radius). So let's just consider the unit cases.

First consider what's going on with the uniform case. Note that the distribution is uniform over the unit square, so that the probability density in a region that's contained within $[-1,1]^2$ is proportional to the area of the region. Specifically, look at the density associated with an element of angle, $d\theta$ near the horizontal (near angle $\theta=0$) and on the diagonal (near angle $\theta=\pi/4$):

enter image description here

Clearly the probability element $df_\theta$ (i.e. area) corresponding to an element of angle ($d\theta$) is larger when the angle is near one of the diagonals. Indeed consider inscribing a circle inside the square; the area spanned by a given tiny angle within the circle is constant, and then the part outside the circle grows as we approach the diagonal, where it at its maximum.

This completely accounts for the pattern you see in the simulations.

Indeed, we can see that the density must be proportional to the length of the segment from the center of the square to its edge; simple trigonometry is sufficient to derive the density from there (e.g. up to the first diagonal at $\pi/4$ the density will be proportional to $\sec(\theta)$, and from there it's easy to find the constant required to make the density integrate to 1.

[Edit: added this next bit to discuss the radius, since the question has changed since my original answer.]

Note that if we had a uniform distribution over the unit circle (i.e. the one we inscribed in the square before) then the density of the radius for that would be proportional to the radius (consider the area of a small annular element of width $dr$ at radius $r$ - i.e. between $r$ and $r+dr$ - has area proportional to $r$). Then as we pass outside the circle, new annular regions with larger radius only get density contributions from the part in the square, so the density decreases (initially quite rapidly, then more slowly) between $1$ and $\sqrt 2$. (Again, fairly simple geometrical notions are sufficient to get the functional form of the density if it is needed.)


By contrast, if the joint distribution is rotationally symmetric about the origin then the probability element at some angle doesn't depend on the angle (this is essentially a tautology!). The bivariate distribution of two independent standard Gaussians is rotationally symmetric about the origin:

enter image description here

(code for this image based on Elan Cohen's code here but there's a nice alternative here, and something between the two here)

Consequently the volume contained in some angle $d\theta$ is the same for every $\theta$, so the density associated with the angle is uniform on $[0,2\pi)$.

[The polar trick typically used for integrating the normal density over the real line can be used to figure out that the density of the squared radius is negative exponential, and from there the density of the radius is simple to identify by a simple transformation argument from the distribution function]

added 94 characters in body
Source Link
Glen_b
  • 290.5k
  • 37
  • 652
  • 1.1k

You're referring to a transformation from a pair of independent variates $(X,Y)$ to the polar representation $(R,\theta)$ (radius and angle), and then looking at the marginal distribution of $\theta$.

I'm going to offer a somewhat intuitive explanation (though a mathematical derivation of the density does essentially what I describe informally).

Note that if you scale the two variables, X and Y by some common scale (e.g. go from U(-1,1) to U(-10,10) or from N(0,1) to N(0,20) on both variables at the same time) that makes no difference to the distribution of the angle (it only affects the scale of the distribution of the radius). So let's just consider the unit cases.

First consider what's going on with the uniform case. Note that the distribution is uniform over the unit square, so that the probability density in a region that's contained within $[-1,1]^2$ is proportional to the area of the region. Specifically, look at the density associated with an element of angle, $d\theta$ near the horizontal (near angle $\theta=0$) and on the diagonal (near angle $\theta=\pi/4$):

enter image description here

Clearly the probability element $df_\theta$ (i.e. area) corresponding to an element of angle ($d\theta$) is larger when the angle is near one of the diagonals. Indeed consider inscribing a circle inside the square; the area spanned by a given tiny angle within the circle is constant, and then the part outside the circle grows as we approach the diagonal, where it at its maximum.

This completely accounts for the pattern you see in the simulations.

Indeed, we can see that the density must be proportional to the length of the segment from the center of the square to its edge; simple trigonometry is sufficient to derive the density from there (e.g. up to the first diagonal at $\pi/4$ the density will be proportional to $\sec(\theta)$, and from there it's easy to find the constant required to make the density integrate to 1.

[Edit: added this next bit to discuss the radius, since the question has changed since my original answer.]

Note that if we had a uniform distribution over the unit circle (i.e. the one we inscribed in the square before) then the density of the radius for that would be proportional to the radius (consider the area of a small annular element of width $dr$ at radius $r$ - i.e. between $r$ and $r+dr$ - has area proportional to $r$). Then as we pass outside the circle, new annular regions with larger radius only get density contributions from the part in the square, so the density decreases (initially quite rapidly, then more slowly) between $1$ and $\sqrt 2$. (Again, fairly simple geometrical notions are sufficient to get the functional form of the density if it is needed.)


By contrast, if the joint distribution is rationally symmetric about the origin then the probability element at some angle doesn't depend on the angle (this is essentially a tautology!). The bivariate distribution of two independent standard Gaussians is rotationally symmetric about the origin:

enter image description here

(code for this image based on Elan Cohen's code here but there's a nice alternative here, and something between the two here)

Consequently the volume contained in some angle $d\theta$ is the same for every $\theta$, so the density associated with the angle is uniform on $[0,2\pi)$.

[The polar trick typically used for integrating the normal density over the real line can be used to figure out that the density of the squared radius is negative exponential, and from there the density of the radius is simple to identify by a simple transformation argument from the distribution function]

You're referring to a transformation from a pair of independent variates $(X,Y)$ to the polar representation $(R,\theta)$ (radius and angle), and then looking at the marginal distribution of $\theta$.

I'm going to offer a somewhat intuitive explanation (though a mathematical derivation of the density does essentially what I describe informally).

Note that if you scale the two variables, X and Y by some common scale (e.g. go from U(-1,1) to U(-10,10) or from N(0,1) to N(0,20) on both variables at the same time) that makes no difference to the distribution of the angle (it only affects the scale of the distribution of the radius). So let's just consider the unit cases.

First consider what's going on with the uniform case. Note that the distribution is uniform over the unit square, so that the probability density in a region that's contained within $[-1,1]^2$ is proportional to the area of the region. Specifically, look at the density associated with an element of angle, $d\theta$ near the horizontal (near angle $\theta=0$) and on the diagonal (near angle $\theta=\pi/4$):

enter image description here

Clearly the probability element $df_\theta$ (i.e. area) corresponding to an element of angle ($d\theta$) is larger when the angle is near one of the diagonals. Indeed consider inscribing a circle inside the square; the area spanned by a given tiny angle within the circle is constant, and then the part outside the circle grows as we approach the diagonal, where it at its maximum.

This completely accounts for the pattern you see in the simulations.

Indeed, we can see that the density must be proportional to the length of the segment from the center of the square to its edge; simple trigonometry is sufficient to derive the density from there (e.g. up to the first diagonal at $\pi/4$ the density will be proportional to $\sec(\theta)$, and from there it's easy to find the constant required to make the density integrate to 1.

[Edit: added this next bit to discuss the radius, since the question has changed since my original answer.]

Note that if we had a uniform distribution over the unit circle (i.e. the one we inscribed in the square before) then the density of the radius for that would be proportional to the radius (consider the area of a small annular element of width $dr$ at radius $r$ - i.e. between $r$ and $r+dr$ - has area proportional to $r$). Then as we pass outside the circle, new annular regions with larger radius only get density contributions from the part in the square, so the density decreases (initially quite rapidly, then more slowly) between $1$ and $\sqrt 2$. (Again, fairly simple geometrical notions are sufficient to get the functional form of the density if it is needed.)


By contrast, if the joint distribution is rationally symmetric about the origin then the probability element at some angle doesn't depend on the angle (this is essentially a tautology!). The bivariate distribution of two independent standard Gaussians is rotationally symmetric about the origin:

enter image description here

(code for this image based on Elan Cohen's code here but there's a nice alternative here)

Consequently the volume contained in some angle $d\theta$ is the same for every $\theta$, so the density associated with the angle is uniform on $[0,2\pi)$.

[The polar trick typically used for integrating the normal density over the real line can be used to figure out that the density of the squared radius is negative exponential, and from there the density of the radius is simple to identify by a simple transformation argument from the distribution function]

You're referring to a transformation from a pair of independent variates $(X,Y)$ to the polar representation $(R,\theta)$ (radius and angle), and then looking at the marginal distribution of $\theta$.

I'm going to offer a somewhat intuitive explanation (though a mathematical derivation of the density does essentially what I describe informally).

Note that if you scale the two variables, X and Y by some common scale (e.g. go from U(-1,1) to U(-10,10) or from N(0,1) to N(0,20) on both variables at the same time) that makes no difference to the distribution of the angle (it only affects the scale of the distribution of the radius). So let's just consider the unit cases.

First consider what's going on with the uniform case. Note that the distribution is uniform over the unit square, so that the probability density in a region that's contained within $[-1,1]^2$ is proportional to the area of the region. Specifically, look at the density associated with an element of angle, $d\theta$ near the horizontal (near angle $\theta=0$) and on the diagonal (near angle $\theta=\pi/4$):

enter image description here

Clearly the probability element $df_\theta$ (i.e. area) corresponding to an element of angle ($d\theta$) is larger when the angle is near one of the diagonals. Indeed consider inscribing a circle inside the square; the area spanned by a given tiny angle within the circle is constant, and then the part outside the circle grows as we approach the diagonal, where it at its maximum.

This completely accounts for the pattern you see in the simulations.

Indeed, we can see that the density must be proportional to the length of the segment from the center of the square to its edge; simple trigonometry is sufficient to derive the density from there (e.g. up to the first diagonal at $\pi/4$ the density will be proportional to $\sec(\theta)$, and from there it's easy to find the constant required to make the density integrate to 1.

[Edit: added this next bit to discuss the radius, since the question has changed since my original answer.]

Note that if we had a uniform distribution over the unit circle (i.e. the one we inscribed in the square before) then the density of the radius for that would be proportional to the radius (consider the area of a small annular element of width $dr$ at radius $r$ - i.e. between $r$ and $r+dr$ - has area proportional to $r$). Then as we pass outside the circle, new annular regions with larger radius only get density contributions from the part in the square, so the density decreases (initially quite rapidly, then more slowly) between $1$ and $\sqrt 2$. (Again, fairly simple geometrical notions are sufficient to get the functional form of the density if it is needed.)


By contrast, if the joint distribution is rationally symmetric about the origin then the probability element at some angle doesn't depend on the angle (this is essentially a tautology!). The bivariate distribution of two independent standard Gaussians is rotationally symmetric about the origin:

enter image description here

(code for this image based on Elan Cohen's code here but there's a nice alternative here, and something between the two here)

Consequently the volume contained in some angle $d\theta$ is the same for every $\theta$, so the density associated with the angle is uniform on $[0,2\pi)$.

[The polar trick typically used for integrating the normal density over the real line can be used to figure out that the density of the squared radius is negative exponential, and from there the density of the radius is simple to identify by a simple transformation argument from the distribution function]

details about radius because question changed
Source Link
Glen_b
  • 290.5k
  • 37
  • 652
  • 1.1k
Loading
added 451 characters in body
Source Link
Glen_b
  • 290.5k
  • 37
  • 652
  • 1.1k
Loading
added 451 characters in body
Source Link
Glen_b
  • 290.5k
  • 37
  • 652
  • 1.1k
Loading
added 587 characters in body
Source Link
Glen_b
  • 290.5k
  • 37
  • 652
  • 1.1k
Loading
Source Link
Glen_b
  • 290.5k
  • 37
  • 652
  • 1.1k
Loading