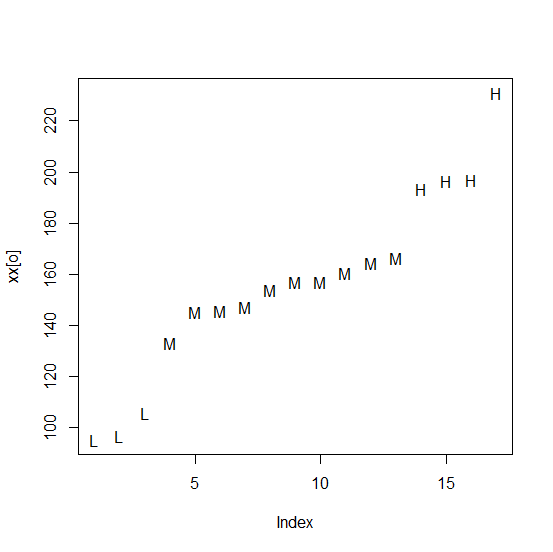
Consider clustering the data into three groups: Low, Medium and High. Now assuming input xx, as in the Note at the end of this answer, and using the R package RWeka (which is an interface to the underlying java-based Weka code) we have that xx[i] is associated with the group whose center, i.e. average value, is centers[i] and whose L/M/H level is lev[i].
library(RWeka)

skm <- SimpleKMeans(xx, list("-N", 3))
centers <- ave(xx, skm$class_ids)
lev <- factor(centers, labels = c("L", "M", "H"))
We can check graphically that this assignment does make sense:
o <- order(xx)
plot(xx[o], pch = as.character(lev)[o])
Note: We used this input:
xx <- c(166.5833333, 96.82416731, 153.7698413, 160.5995717, 157.1428571,
147.2727273, 157.0458404, 145.8111314, 193.438914, 231.0717797, 95.20264682,
133.3333333, 145.4234388, 105.8333333, 196.5690377, 196.9972702, 164.4359465)

