image size increased
Source Link
luchonacho
  • 2.7k
  • 5
  • 26
  • 47

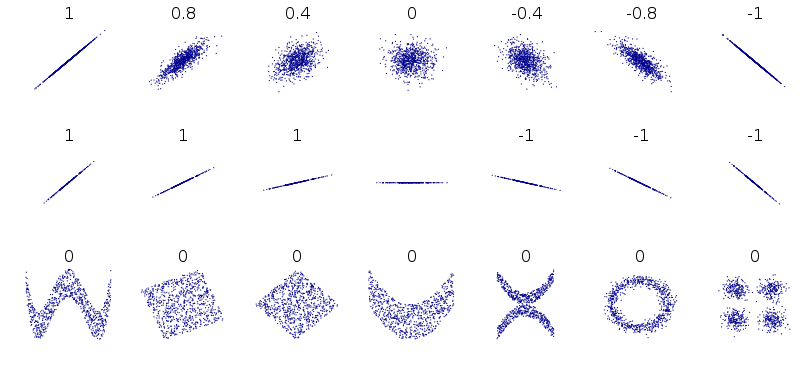
I found the following figure from wiki is very useful for intuition. In particular, the bottom row show examples of uncorrelated but dependent distributions.

enter image description here

Caption of the above plot in wiki: Several sets of (x, y) points, with the Pearson correlation coefficient of x and y for each set. Note that the correlation reflects the noisiness and direction of a linear relationship (top row), but not the slope of that relationship (middle), nor many aspects of nonlinear relationships (bottom). N.B.: the figure in the center has a slope of 0 but in that case the correlation coefficient is undefined because the variance of Y is zero.

I found the following figure from wiki is very useful for intuition. In particular, the bottom row show examples of uncorrelated but dependent distributions.

Caption of the above plot in wiki: Several sets of (x, y) points, with the Pearson correlation coefficient of x and y for each set. Note that the correlation reflects the noisiness and direction of a linear relationship (top row), but not the slope of that relationship (middle), nor many aspects of nonlinear relationships (bottom). N.B.: the figure in the center has a slope of 0 but in that case the correlation coefficient is undefined because the variance of Y is zero.
I found the following figure from wiki is very useful for intuition. In particular, the bottom row show examples of uncorrelated but dependent distributions.

enter image description here

Caption of the above plot in wiki: Several sets of (x, y) points, with the Pearson correlation coefficient of x and y for each set. Note that the correlation reflects the noisiness and direction of a linear relationship (top row), but not the slope of that relationship (middle), nor many aspects of nonlinear relationships (bottom). N.B.: the figure in the center has a slope of 0 but in that case the correlation coefficient is undefined because the variance of Y is zero.

Source Link
yuqian
  • 1.3k
  • 9
  • 8

I found the following figure from wiki is very useful for intuition. In particular, the bottom row show examples of uncorrelated but dependent distributions.

Caption of the above plot in wiki: Several sets of (x, y) points, with the Pearson correlation coefficient of x and y for each set. Note that the correlation reflects the noisiness and direction of a linear relationship (top row), but not the slope of that relationship (middle), nor many aspects of nonlinear relationships (bottom). N.B.: the figure in the center has a slope of 0 but in that case the correlation coefficient is undefined because the variance of Y is zero.