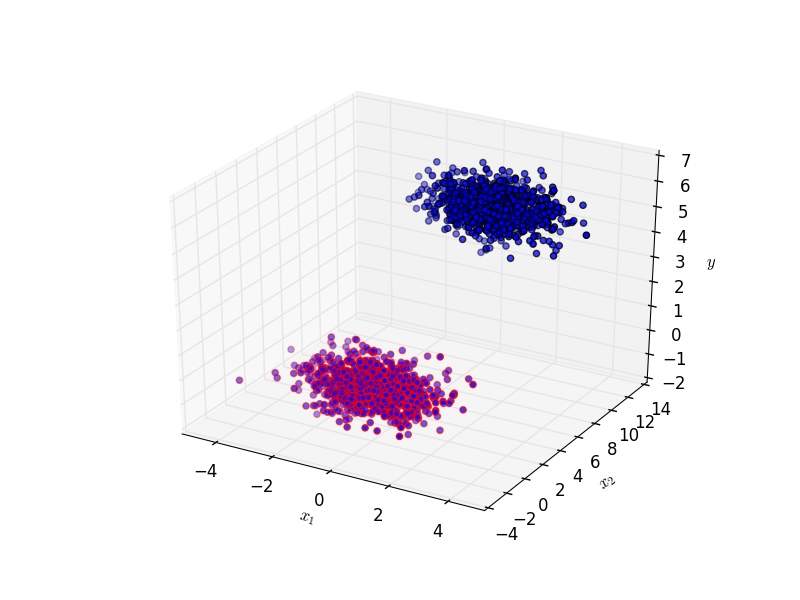
I have a set of data with continuous features $x_1, x_2,...,x_n$, as well as a continuous $y$ which is some complicated, unknown function of the $x_i$. Each data point, furthermore, has a discrete label (category). I want to somehow quantify which variables $x_i$ are most responsible for the variance of $y$ between the groups.
Below is a simple example. The blue and red dots are in different categories. Clearly most of the variation in $y$ between the two categories is due to $x_2$.
Are there any statistical methods that I can use for this?

