added 254 characters in body
Source Link
Glen_b
  • 290.5k
  • 37
  • 652
  • 1.1k

There's nothing stopping you using linear regression on any two columns of numbers you like. There are times when it might even be a quite sensible choice.

However, the properties of what you get out won't necessarily be useful (e.g. won't necessarily be all you might want them to be).

Generally with regression you're trying to fit some relationship between the conditional mean of Y and the predictor -- i.e. fit relationships of some form $E(Y|x) = g(x)$; arguably modelling the behavior of the conditional expectation is what 'regression' is. [Linear regression is when you take one particular form for $g$, specifically one where $g$ is linear in the coefficients; it can include models where the relationship between the conditional mean of $Y$ and $x$ that is curved.]

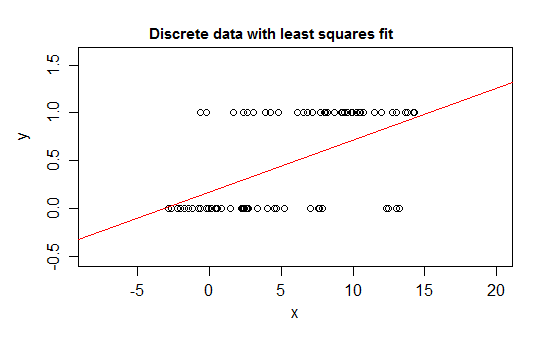
For example, consider an extreme cases of discreteness, a response variable whose distribution is at either 0 or 1 and which takes the value 1 with probability that changes as some predictor ($x$) changes. That is $E(Y|x) = P(Y=1|X=x)$.

If you fit that sort of relationship with a linear regression model, then aside from a narrow interval, it will predict values for $E(Y)$ that are impossible -- either below $0$ or above $1$:

0-1 data and least squares fit

Indeed, it's also possible to see that as the expectation approaches the boundaries, the values must more and more frequently take the value at that boundary, so its variance gets smaller than if the expectation were near the middle -- the variance must decrease to 0. So an ordinary regression gets the weights wrong, underweighting the data in the region where the conditional expectation is near 0 or 1. SImilarSimilar effects occur if you have a variable bounded between a$a$ and b$b$, say (such as each observation being a discrete count out of a known total possible count for that observation)

In addition, we normally expect the conditional mean to asymptote toward the upper and lower limits, which means the relationship would normally be curved, not straight, so our linear regression likely gets it wrong within the range of the data as well.

Similar issues occur with data that's only bounded on one side (e.g. counts thatbounded below by 0 but which don't have an upper boundary) when you're near that one boundary.

It's possible (if rare) to have discrete data that's not bounded on either end; if the variable takes a lot of different values the discreteness may be of relatively little consequence as long as the model's description of the mean and the variance are reasonable.

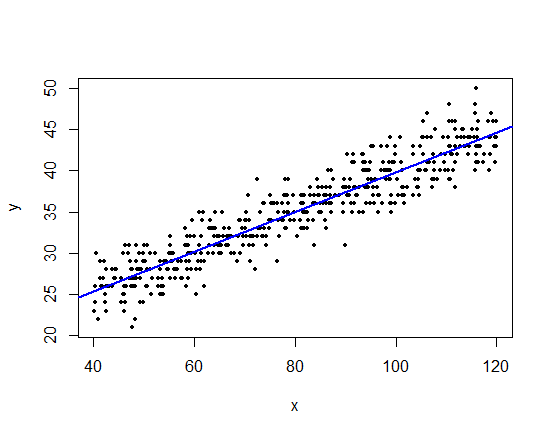
Here's an example that it would be completely reasonable to use linear regression on:

plot showing discrete y as function of x where linear regression makes sense

Even though in any thin strip of x-values there's only a few different y-values that are likely to be observed (perhaps around 10 for intervals of width 1), the expectation can be well-estimated, and even standardthe properties of standard errors and p-values and confidence intervals will all be more or less reasonable in this particular case. Prediction intervals will tend to work somewhat less well (because the non-normality will tend to have a more direct impact in that case)

--

If you want to perform hypothesis tests or calculate confidence or prediction intervals, the usual procedures make an assumption of normality. In some circumstances, that can matter. However, it's possible to perform inference and prediction without making that particular assumption if it might be an issue.

There's nothing stopping you using linear regression on any two columns of numbers you like. There are times when it might even be a quite sensible choice.

However, the properties of what you get out won't necessarily be useful (e.g. won't necessarily be all you might want them to be).

Generally with regression you're trying to fit some relationship between the conditional mean of Y and the predictor -- i.e. fit relationships of some form $E(Y|x) = g(x)$; arguably modelling the behavior of the conditional expectation is what 'regression' is. [Linear regression is when you take one particular form for $g$]

For example, consider an extreme cases of discreteness, a response variable whose distribution is at either 0 or 1 and which takes the value 1 with probability that changes as some predictor ($x$) changes. That is $E(Y|x) = P(Y=1|X=x)$.

If you fit that sort of relationship with a linear regression model, then aside from a narrow interval, it will predict values for $E(Y)$ that are impossible -- either below $0$ or above $1$:

0-1 data and least squares fit

Indeed, it's also possible to see that as the expectation approaches the boundaries, the values must more and more frequently take the value at that boundary, so its variance gets smaller than if the expectation were near the middle -- the variance must decrease to 0. So an ordinary regression gets the weights wrong, underweighting the data in the region where the conditional expectation is near 0 or 1. SImilar effects occur if you have a variable bounded between a and b, say (such as each observation being a discrete count out of a known total possible count for that observation)

In addition, we normally expect the conditional mean to asymptote toward the upper and lower limits, which means the relationship would normally be curved, not straight, so our linear regression likely gets it wrong within the range of the data as well.

Similar issues occur with data that's only bounded on one side (e.g. counts that don't have an upper boundary) when you're near that one boundary.

It's possible (if rare) to have discrete data that's not bounded on either end; if the variable takes a lot of different values the discreteness may be of relatively little consequence as long as the model's description of the mean and the variance are reasonable.

Here's an example that it would be completely reasonable to use linear regression on:

plot showing discrete y as function of x where linear regression makes sense

Even though in any thin strip of x-values there's only a few different y-values that are likely to be observed (perhaps around 10 for intervals of width 1), the expectation can be well-estimated, and even standard errors and p-values and confidence intervals will all be more or less reasonable in this particular case. Prediction intervals will tend to work somewhat less well (because the non-normality will tend to have a more direct impact in that case)

--

If you want to perform hypothesis tests or calculate confidence or prediction intervals, the usual procedures make an assumption of normality. In some circumstances, that can matter. However, it's possible to inference without making that particular assumption.

There's nothing stopping you using linear regression on any two columns of numbers you like. There are times when it might even be a quite sensible choice.

However, the properties of what you get out won't necessarily be useful (e.g. won't necessarily be all you might want them to be).

Generally with regression you're trying to fit some relationship between the conditional mean of Y and the predictor -- i.e. fit relationships of some form $E(Y|x) = g(x)$; arguably modelling the behavior of the conditional expectation is what 'regression' is. [Linear regression is when you take one particular form for $g$, specifically one where $g$ is linear in the coefficients; it can include models where the relationship between the conditional mean of $Y$ and $x$ that is curved.]

For example, consider an extreme cases of discreteness, a response variable whose distribution is at either 0 or 1 and which takes the value 1 with probability that changes as some predictor ($x$) changes. That is $E(Y|x) = P(Y=1|X=x)$.

If you fit that sort of relationship with a linear regression model, then aside from a narrow interval, it will predict values for $E(Y)$ that are impossible -- either below $0$ or above $1$:

0-1 data and least squares fit

Indeed, it's also possible to see that as the expectation approaches the boundaries, the values must more and more frequently take the value at that boundary, so its variance gets smaller than if the expectation were near the middle -- the variance must decrease to 0. So an ordinary regression gets the weights wrong, underweighting the data in the region where the conditional expectation is near 0 or 1. Similar effects occur if you have a variable bounded between $a$ and $b$, say (such as each observation being a discrete count out of a known total possible count for that observation)

In addition, we normally expect the conditional mean to asymptote toward the upper and lower limits, which means the relationship would normally be curved, not straight, so our linear regression likely gets it wrong within the range of the data as well.

Similar issues occur with data that's only bounded on one side (e.g. counts bounded below by 0 but which don't have an upper boundary) when you're near that one boundary.

It's possible (if rare) to have discrete data that's not bounded on either end; if the variable takes a lot of different values the discreteness may be of relatively little consequence as long as the model's description of the mean and the variance are reasonable.

Here's an example that it would be completely reasonable to use linear regression on:

plot showing discrete y as function of x where linear regression makes sense

Even though in any thin strip of x-values there's only a few different y-values that are likely to be observed (perhaps around 10 for intervals of width 1), the expectation can be well-estimated, and the properties of standard errors and p-values and confidence intervals will all be more or less reasonable in this particular case. Prediction intervals will tend to work somewhat less well (because the non-normality will tend to have a more direct impact in that case)

--

If you want to perform hypothesis tests or calculate confidence or prediction intervals, the usual procedures make an assumption of normality. In some circumstances, that can matter. However, it's possible to perform inference and prediction without making that particular assumption if it might be an issue.
added 3 characters in body
Source Link
Glen_b
  • 290.5k
  • 37
  • 652
  • 1.1k

There's nothing stopping you using linear regression on any two columns of numbers you like. There are times when it might even be a quite sensible choice.

However, the properties of what you get out won't necessarily be useful (e.g. won't necessarily be all you might want them to be).

Generally with regression you're trying to fit some relationship between the conditional mean of Y and the predictor -- i.e. fit relationships of some form $E(Y|x) = g(x)$; arguably modelling the behavior of the conditional expectation is what 'regression' is. [Linear regression is when you take one particular form for $g$]

For example, consider an extreme cases of discreteness, a response variable whose distribution is at either 0 or 1 and which takes the value 1 with probability that changes as some predictor ($x$) changes. That is $E(Y|x) = P(Y=1|X=x)$.

If you fit that sort of relationship with a linear regression model, then aside from a narrow interval, it will predict values for $E(Y)$ that are impossible -- either below $0$ or above $1$:

0-1 data and least squares fit

Indeed, it's also possible to see that as the expectation approaches the boundaries, the values must more and more frequently take the value at that boundary, so its variance gets smaller than if the expectation were near the middle -- the variance must decrease to 0. So an ordinary regression gets the weights wrong, underweighting the data in the region where the conditional expectation is near 0 or 1. SImilar effects occur if you have a variable bounded between a and b, say (such as each observation being a discrete count out of a known total possible count for that observation)

In addition, we normally expect the conditional mean to asymptote toward the upper and lower limits, which means the relationship would normally be curved, not straight, so our linear regression likely gets it wrong within the range of the data as well.

Similar issues occur with data that's only bounded on one side (e.g. counts that don't have an upper boundary) when you're near that one boundary.

It's possible (if rare) to have discrete data that's not bounded on either end; if the variable takes a lot of different values the discreteness may be of relatively little consequence as long as the model's description of the mean and the variance are reasonable.

Here's an example that it would be completely reasonable to use linear regression on:

plot showing discrete y as function of x where linear regression makes sense

Even though in any thin strip of x-values there's only a few different y-values that are likely to be observed (perhaps around 10 for intervals of width 1), the expectation can be well-estimated, and even standard errors and p-values and confidence intervals will all be more or less reasonable in this particular case. Prediction intervals will tend to work somewhat less well (because the non-normality will tend to have a more direct impact in that case)

--

If you want to perform hypothesis tests or calculate confidence or prediction intervals, the usual procedures make an assumption of normality. In some circumstances, that can matter. However, it's possible to inference without making that particular assumption.

There's nothing stopping you using linear regression on any two columns of numbers you like. There are times when it might even be a quite sensible choice.

However, the properties of what you get out won't necessarily be useful (e.g. won't necessarily be all you might want them to be).

Generally with regression you're trying to fit some relationship between the conditional mean of Y and the predictor -- i.e. fit relationships of some form $E(Y|x) = g(x)$; arguably modelling the behavior of the conditional expectation is what 'regression' is. [Linear regression is when you take one particular form for $g$]

For example, consider an extreme cases of discreteness, a response variable whose distribution is either 0 or 1 and which takes the value 1 with probability that changes as some predictor ($x$) changes. That is $E(Y|x) = P(Y=1|X=x)$.

If you fit that sort of relationship with a linear regression model, then aside from a narrow interval, it will predict values for $E(Y)$ that are impossible -- either below $0$ or above $1$:

0-1 data and least squares fit

Indeed, it's also possible to see that as the expectation approaches the boundaries, the values must more and more frequently take the value at that boundary, so its variance gets smaller than if the expectation were near the middle -- the variance must decrease to 0. So an ordinary regression gets the weights wrong, underweighting the data in the region where the conditional expectation is near 0 or 1. SImilar effects occur if you have a variable bounded between a and b, say (such as each observation being a discrete count out of a known total possible count for that observation)

In addition, we normally expect the conditional mean to asymptote toward the upper and lower limits, which means the relationship would normally be curved, not straight, so our linear regression likely gets it wrong within the range of the data as well.

Similar issues occur with data that's only bounded on one side (e.g. counts that don't have an upper boundary) when you're near that one boundary.

It's possible (if rare) to have discrete data that's not bounded on either end; if the variable takes a lot of different values the discreteness may be of relatively little consequence as long as the model's description of the mean and the variance are reasonable.

Here's an example that it would be completely reasonable to use linear regression on:

plot showing discrete y as function of x where linear regression makes sense

Even though in any thin strip of x-values there's only a few different y-values that are likely to be observed (perhaps around 10 for intervals of width 1), the expectation can be well-estimated, and even standard errors and p-values and confidence intervals will all be more or less reasonable in this particular case. Prediction intervals will tend to work somewhat less well (because the non-normality will tend to have a more direct impact in that case)

--

If you want to perform hypothesis tests or calculate confidence or prediction intervals, the usual procedures make an assumption of normality. In some circumstances, that can matter. However, it's possible to inference without making that particular assumption.

There's nothing stopping you using linear regression on any two columns of numbers you like. There are times when it might even be a quite sensible choice.

However, the properties of what you get out won't necessarily be useful (e.g. won't necessarily be all you might want them to be).

Generally with regression you're trying to fit some relationship between the conditional mean of Y and the predictor -- i.e. fit relationships of some form $E(Y|x) = g(x)$; arguably modelling the behavior of the conditional expectation is what 'regression' is. [Linear regression is when you take one particular form for $g$]

For example, consider an extreme cases of discreteness, a response variable whose distribution is at either 0 or 1 and which takes the value 1 with probability that changes as some predictor ($x$) changes. That is $E(Y|x) = P(Y=1|X=x)$.

If you fit that sort of relationship with a linear regression model, then aside from a narrow interval, it will predict values for $E(Y)$ that are impossible -- either below $0$ or above $1$:

0-1 data and least squares fit

Indeed, it's also possible to see that as the expectation approaches the boundaries, the values must more and more frequently take the value at that boundary, so its variance gets smaller than if the expectation were near the middle -- the variance must decrease to 0. So an ordinary regression gets the weights wrong, underweighting the data in the region where the conditional expectation is near 0 or 1. SImilar effects occur if you have a variable bounded between a and b, say (such as each observation being a discrete count out of a known total possible count for that observation)

In addition, we normally expect the conditional mean to asymptote toward the upper and lower limits, which means the relationship would normally be curved, not straight, so our linear regression likely gets it wrong within the range of the data as well.

Similar issues occur with data that's only bounded on one side (e.g. counts that don't have an upper boundary) when you're near that one boundary.

It's possible (if rare) to have discrete data that's not bounded on either end; if the variable takes a lot of different values the discreteness may be of relatively little consequence as long as the model's description of the mean and the variance are reasonable.

Here's an example that it would be completely reasonable to use linear regression on:

plot showing discrete y as function of x where linear regression makes sense

Even though in any thin strip of x-values there's only a few different y-values that are likely to be observed (perhaps around 10 for intervals of width 1), the expectation can be well-estimated, and even standard errors and p-values and confidence intervals will all be more or less reasonable in this particular case. Prediction intervals will tend to work somewhat less well (because the non-normality will tend to have a more direct impact in that case)

--

If you want to perform hypothesis tests or calculate confidence or prediction intervals, the usual procedures make an assumption of normality. In some circumstances, that can matter. However, it's possible to inference without making that particular assumption.

added 608 characters in body
Source Link
Glen_b
  • 290.5k
  • 37
  • 652
  • 1.1k

There's nothing stopping you using linear regression on any two columns of numbers you like. There are times when it might even be a quite sensible choice.

However, the properties of what you get out won't necessarily be useful (e.g. won't necessarily be all you might want them to be).

Generally with regression you're trying to fit some relationship between the conditional mean of Y and the predictor -- i.e. fit relationships of some form $E(Y|x) = g(x)$; arguably modelling the behavior of the conditional expectation is what 'regression' is. [Linear regression is when you take one particular form for $g$]

For example, consider an extreme cases of discreteness, a response variable whose distribution is either 0 or 1 and which takes the value 1 with probability that changes as some predictor ($x$) changes. That is $E(Y|x) = P(Y=1|X=x)$.

If you fit that sort of relationship with a linear regression model, then aside from a narrow interval, it will predict values for $E(Y)$ that are impossible -- either below $0$ or above $1$:

0-1 data and least squares fit

Indeed, it's also possible to see that as the expectation approaches the boundaries, the values must more and more frequently take the value at that boundary, so its variance gets smaller than if the expectation were near the middle -- the variance must decrease to 0. So an ordinary regression gets the weights wrong, underweighting the data in the region where the conditional expectation is near 0 or 1. SImilar effects occur if you have a variable bounded between a and b, say (such as each observation being a discrete count out of a known total possible count for that observation)

In addition, we normally expect the conditional mean to asymptote toward the upper and lower limits, which means the relationship would normally be curved, not straight, so our linear regression likely gets it wrong within the range of the data as well.

Similar issues occur with data that's only bounded on one side (e.g. counts that don't have an upper boundary) when you're near that one boundary.

It's possible (if rare) to have discrete data that's not bounded on either end; if the variable takes a lot of different values the discreteness may be of relatively little consequence as long as the model's description of the mean and the variance are reasonable.

Here's an example that it would be completely reasonable to use linear regression on:

plot showing discrete y as function of x where linear regression makes sense

Even though in any thin strip of x-values there's only a few different y-values that are likely to be observed (perhaps around 10 for intervals of width 1), the expectation can be well-estimated, and even standard errors and p-values and confidence intervals will all be more or less reasonable in this particular case. Prediction intervals will tend to work somewhat less well (because the non-normality will tend to have a more direct impact in that case)

--

If you want to perform hypothesis tests or calculate confidence or prediction intervals, the usual procedures make an assumption of normality. In some circumstances, that can matter. However, it's possible to inference without making that particular assumption.

There's nothing stopping you using linear regression on any two columns of numbers you like. There are times when it might even be a quite sensible choice.

However, the properties of what you get out won't necessarily be useful (e.g. won't necessarily be all you might want them to be).

Generally with regression you're trying to fit some relationship between the conditional mean of Y and the predictor -- i.e. fit relationships of some form $E(Y|x) = g(x)$; arguably modelling the behavior of the conditional expectation is what 'regression' is. [Linear regression is when you take one particular form for $g$]

For example, consider an extreme cases of discreteness, a response variable whose distribution is either 0 or 1 and which takes the value 1 with probability that changes as some predictor ($x$) changes. That is $E(Y|x) = P(Y=1|X=x)$.

If you fit that sort of relationship with a linear regression model, then aside from a narrow interval, it will predict values for $E(Y)$ that are impossible -- either below $0$ or above $1$:

0-1 data and least squares fit

Indeed, it's also possible to see that as the expectation approaches the boundaries, the values must more and more frequently take the value at that boundary, so its variance gets smaller than if the expectation were near the middle -- the variance must decrease to 0. So an ordinary regression gets the weights wrong, underweighting the data in the region where the conditional expectation is near 0 or 1. SImilar effects occur if you have a variable bounded between a and b, say (such as each observation being a discrete count out of a known total possible count for that observation)

In addition, we normally expect the conditional mean to asymptote toward the upper and lower limits, which means the relationship would normally be curved, not straight, so our linear regression likely gets it wrong within the range of the data as well.

Similar issues occur with data that's only bounded on one side (e.g. counts that don't have an upper boundary) when you're near that one boundary.

It's possible (if rare) to have discrete data that's not bounded on either end; if the variable takes a lot of different values the discreteness may be of relatively little consequence as long as the model's description of the mean and the variance are reasonable.

Here's an example that it would be completely reasonable to use linear regression on:

plot showing discrete y as function of x where linear regression makes sense

Even though in any thin strip of x-values there's only a few different y-values that are likely to be observed (perhaps around 10 for intervals of width 1), the expectation can be well-estimated, and even standard errors and p-values and confidence intervals will all be more or less reasonable in this particular case. Prediction intervals will tend to work somewhat less well (because the non-normality will tend to have a more direct impact in that case)

--

If you want to perform hypothesis tests or calculate confidence or prediction intervals, the usual procedures make an assumption of normality. In some circumstances, that can matter. However, it's possible to inference without making that particular assumption.

added 220 characters in body
Source Link
Glen_b
  • 290.5k
  • 37
  • 652
  • 1.1k
Loading
Source Link
Glen_b
  • 290.5k
  • 37
  • 652
  • 1.1k
Loading