Post Closed as "Duplicate" by gung - Reinstate Monica
Post Reopened by gung - Reinstate Monica
added 45 characters in body
Source Link
Juanchi
  • 389
  • 5
  • 14

I did a simple experiment with trees: 5 species (sp) and two management (trt). I assessed the diameter (diam) through the time (month=1:24) and I'm interesting in the factors interaction effect, I mean if the management is suitable for some species.

The dataset has some limitations since it is not balanced, so in 2 out of 10 factors combinations (sp*trt) I have 4 trees (subjects) and for the rest there are 5 trees:

       sp    trt trees
1       A      L     5
2       A      W     5
3       B      L     5
4       B      W     5
5       C      L     5
6       C      W     5
7       P      L     4
8       P      W     5
9       T      L     5
10      T      W     4

I fitted the following model:

m1 <- lmer(diam ~ trt * sp * month + (1|tree), data = dat1)

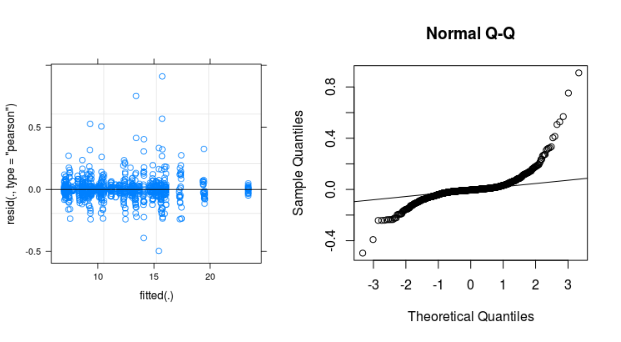
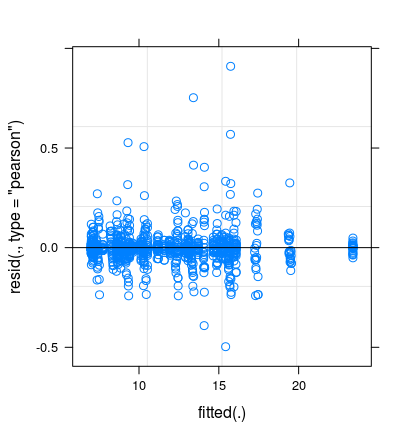
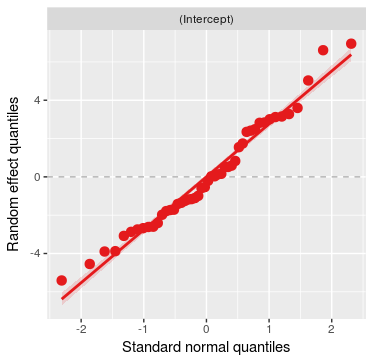
I'm not sure if I'm doing right, mainly if the model is right...

enter image description hereenter image description here enter image description here

If the model is correct, and the anova is the following table:

Analysis of Variance Table
             Df  Sum Sq Mean Sq F value
trt           1 0.12110 0.12110 17.3756
sp            4 0.06761 0.01690  2.4251
month         1 0.33917 0.33917 48.6659
trt:sp        4 0.00436 0.00109  0.1564
trt:month     1 0.15814 0.15814 22.6900
sp:month      4 0.24445 0.06111  8.7687
trt:sp:month  4 0.19109 0.04777  6.8547

What is it meaning about the effects?

I did a simple experiment with trees: 5 species (sp) and two management (trt). I assessed the diameter (diam) through the time (month=1:24) and I'm interesting in the factors interaction effect, I mean if the management is suitable for some species.

The dataset has some limitations since it is not balanced, so in 2 out of 10 factors combinations (sp*trt) I have 4 trees (subjects) and for the rest there are 5 trees:

       sp    trt trees
1       A      L     5
2       A      W     5
3       B      L     5
4       B      W     5
5       C      L     5
6       C      W     5
7       P      L     4
8       P      W     5
9       T      L     5
10      T      W     4

I fitted the following model:

m1 <- lmer(diam ~ trt * sp * month + (1|tree), data = dat1)

I'm not sure if I'm doing right, mainly if the model is right...

enter image description here

If the model is correct, and the anova is the following table:

Analysis of Variance Table
             Df  Sum Sq Mean Sq F value
trt           1 0.12110 0.12110 17.3756
sp            4 0.06761 0.01690  2.4251
month         1 0.33917 0.33917 48.6659
trt:sp        4 0.00436 0.00109  0.1564
trt:month     1 0.15814 0.15814 22.6900
sp:month      4 0.24445 0.06111  8.7687
trt:sp:month  4 0.19109 0.04777  6.8547

What is it meaning about the effects?
I did a simple experiment with trees: 5 species (sp) and two management (trt). I assessed the diameter (diam) through the time (month=1:24) and I'm interesting in the factors interaction effect, I mean if the management is suitable for some species.

The dataset has some limitations since it is not balanced, so in 2 out of 10 factors combinations (sp*trt) I have 4 trees (subjects) and for the rest there are 5 trees:

       sp    trt trees
1       A      L     5
2       A      W     5
3       B      L     5
4       B      W     5
5       C      L     5
6       C      W     5
7       P      L     4
8       P      W     5
9       T      L     5
10      T      W     4

I fitted the following model:

m1 <- lmer(diam ~ trt * sp * month + (1|tree), data = dat1)

I'm not sure if I'm doing right, mainly if the model is right...

enter image description here enter image description here

If the model is correct, and the anova is the following table:

Analysis of Variance Table
             Df  Sum Sq Mean Sq F value
trt           1 0.12110 0.12110 17.3756
sp            4 0.06761 0.01690  2.4251
month         1 0.33917 0.33917 48.6659
trt:sp        4 0.00436 0.00109  0.1564
trt:month     1 0.15814 0.15814 22.6900
sp:month      4 0.24445 0.06111  8.7687
trt:sp:month  4 0.19109 0.04777  6.8547
anova table added
Source Link
Juanchi
  • 389
  • 5
  • 14

I did a simple experiment with trees: 5 species (sp) and two management (trt). I assessed the diameter (diam) through the time (month=1:24) and I'm interesting in the factors interaction effect, I mean if the management is suitable for some species.

The dataset has some limitations since it is not balanced, so in 2 out of 10 factors combinations (sp*trt) I have 4 trees (subjects) and for the rest there are 5 trees:

       sp    trt trees
1       A      L     5
2       A      W     5
3       B      L     5
4       B      W     5
5       C      L     5
6       C      W     5
7       P      L     4
8       P      W     5
9       T      L     5
10      T      W     4

I fitted the following model:

m1 <- lmer(diam ~ trt * sp * month + (1|tree), data = dat1)

I'm not sure if I'm doing right, mainly if the model is right...

enter image description here

If the model is correct, and the anova is the following table:

Analysis of Variance Table
             Df  Sum Sq Mean Sq F value
trt           1 0.12110 0.12110 17.3756
sp            4 0.06761 0.01690  2.4251
month         1 0.33917 0.33917 48.6659
trt:sp        4 0.00436 0.00109  0.1564
trt:month     1 0.15814 0.15814 22.6900
sp:month      4 0.24445 0.06111  8.7687
trt:sp:month  4 0.19109 0.04777  6.8547

What is it meaning about the effects?
I did a simple experiment with trees: 5 species (sp) and two management (trt). I assessed the diameter (diam) through the time (month=1:24) and I'm interesting in the factors interaction effect, I mean if the management is suitable for some species.

The dataset has some limitations since it is not balanced, so in 2 out of 10 factors combinations (sp*trt) I have 4 trees (subjects) and for the rest there are 5 trees:

       sp    trt trees
1       A      L     5
2       A      W     5
3       B      L     5
4       B      W     5
5       C      L     5
6       C      W     5
7       P      L     4
8       P      W     5
9       T      L     5
10      T      W     4

I fitted the following model:

m1 <- lmer(diam ~ trt * sp * month + (1|tree), data = dat1)

I'm not sure if I'm doing right, mainly if the model is right...

enter image description here

If the model is correct, and the anova is the following table:

Analysis of Variance Table
             Df  Sum Sq Mean Sq F value
trt           1 0.12110 0.12110 17.3756
sp            4 0.06761 0.01690  2.4251
month         1 0.33917 0.33917 48.6659
trt:sp        4 0.00436 0.00109  0.1564
trt:month     1 0.15814 0.15814 22.6900
sp:month      4 0.24445 0.06111  8.7687
trt:sp:month  4 0.19109 0.04777  6.8547

What is it meaning about the effects?
added residual plots
Source Link
Juanchi
  • 389
  • 5
  • 14

I did a simple experiment with trees: 5 species (sp) and two management (trt). I assessed the diameter (diam) through the time (month=1:24) and I'm interesting in the factors interaction effect, I mean if the management is suitable for some species.

The dataset has some limitations since it is not balanced, so in 2 out of 10 factors combinations (sp*trt) I have 4 trees (subjects) and for the rest there are 5 trees:

       sp    trt trees
1       A      L     5
2       A      W     5
3       B      L     5
4       B      W     5
5       C      L     5
6       C      W     5
7       P      L     4
8       P      W     5
9       T      L     5
10      T      W     4

I fitted the following model:

m1 <- lmer(diam ~ trt * sp * month + (1|tree), data = dat1)

I'm not sure if I'm doing right, mainly if the model is right...

enter image description here

I did a simple experiment with trees: 5 species (sp) and two management (trt). I assessed the diameter (diam) through the time (month=1:24) and I'm interesting in the factors interaction effect, I mean if the management is suitable for some species.

The dataset has some limitations since it is not balanced, so in 2 out of 10 factors combinations (sp*trt) I have 4 trees (subjects) and for the rest there are 5 trees:

       sp    trt trees
1       A      L     5
2       A      W     5
3       B      L     5
4       B      W     5
5       C      L     5
6       C      W     5
7       P      L     4
8       P      W     5
9       T      L     5
10      T      W     4

I fitted the following model:

m1 <- lmer(diam ~ trt * sp * month + (1|tree), data = dat1)

I'm not sure if I'm doing right, mainly if the model is right...

enter image description here

edited tags
Link
amoeba
  • 107.3k
  • 36
  • 321
  • 347
Loading
added 8 characters in body
Source Link
Juanchi
  • 389
  • 5
  • 14
Loading
Post Closed as "Not suitable for this site" by Michael R. Chernick, Peter Flom
edited title
Link
Michael R. Chernick
  • 43.2k
  • 28
  • 85
  • 159
Loading
added 6 characters in body
Source Link
Juanchi
  • 389
  • 5
  • 14
Loading
Source Link
Juanchi
  • 389
  • 5
  • 14
Loading