There are four variables have significant interaction effects in my logistic regression model, but I still did not get good way to interpret it through R software.

There are some discussion on 3-way interactions, it seems that plot would be a way. But their discussions are for linear regression rather than logistic regression

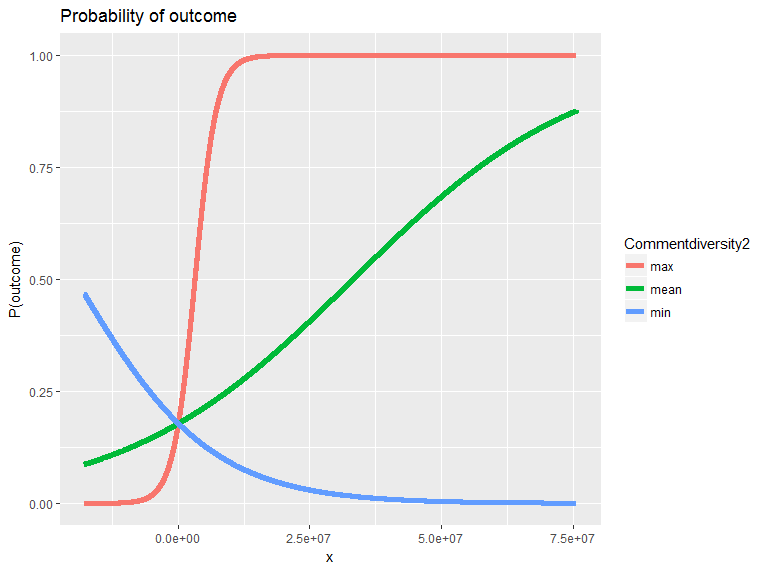
For the two-way interaction, I used the ggplot to plot the probability with three groups moderation variable setting (min, mean, max), please see the attached plot for two-way interaction

enter image description here

Now I really would like to ask how to plot three/four-way interactions in logistic regression model in order to interpret this interactions well.  Thanks very much.

Best,

Qian
There are four variables have significant interaction effects in my logistic regression model, but I still did not get good way to interpret it through R software.

There are some discussion on 3-way interactions, it seems that plot would be a way. But their discussions are for linear regression rather than logistic regression

For the two-way interaction, I used the ggplot to plot the probability with three groups moderation variable setting (min, mean, max), please see the attached plot for two-way interaction

enter image description here

Now I really would like to ask how to plot three/four-way interactions in logistic regression model in order to interpret this interactions well.

Source Link

How to interpret three/four-way interactions(continous) in logistic regression model through plotting in R

There are four variables have significant interaction effects in my logistic regression model, but I still did not get good way to interpret it through R software.

There are some discussion on 3-way interactions, it seems that plot would be a way. But their discussions are for linear regression rather than logistic regression

For the two-way interaction, I used the ggplot to plot the probability with three groups moderation variable setting (min, mean, max), please see the attached plot for two-way interaction

enter image description here

Now I really would like to ask how to plot three/four-way interactions in logistic regression model in order to interpret this interactions well.  Thanks very much.

Best,

Qian