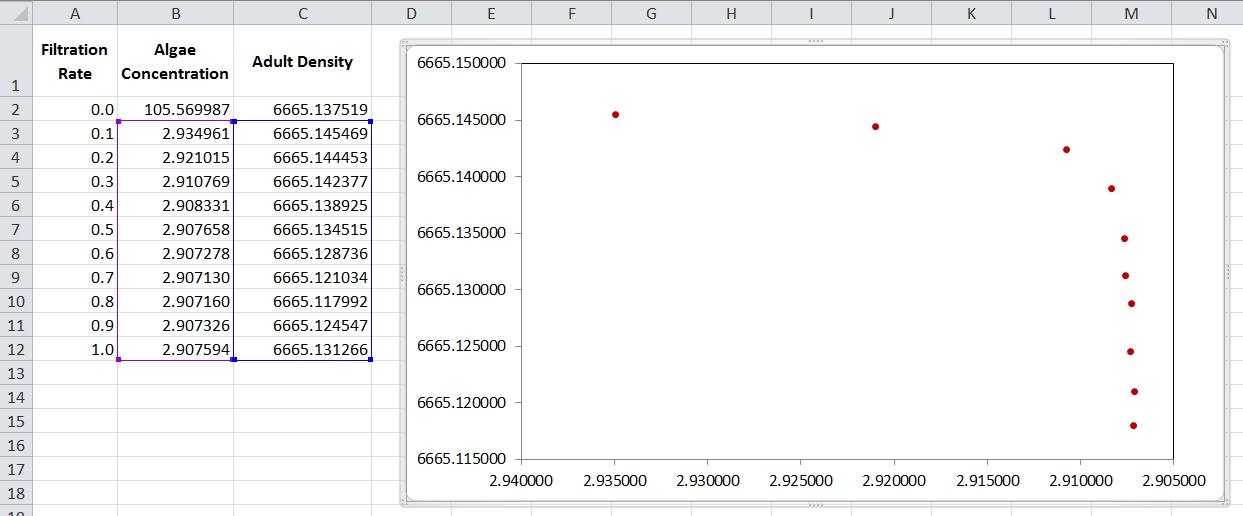
I have a small set of data that I need to fit a curve to (see image and data below).
algaeConc    adultDens
2.934961    6665.145469
2.921015    6665.144453
2.910769    6665.142377
2.908331    6665.138925
2.907658    6665.134515
2.907278    6665.128736
2.907130    6665.121034
2.907160    6665.117992
2.907326    6665.124547
2.907594    6665.131266
The data came out of a simulation model for which I was stressing a parameter (filtration rate) then recording what happened to my variables (algae concentration and adult density). Now, I need to fit a curve to this, and I have to admit I never saw this kind of decline before. So, I would like some suggestions about how to fit a curve to this. It seems to me that a power law might be needed, but I have never worked with those before and am not sure how to go about it.
I've spent all day reading about power laws and trying to fit it on R but only managed to confuse myself, so any help will be highly appreciated.
Edit: The X axis is inverted to match the stress on the filtration parameter (increasing stress, caused a decrease in algae concentration).

