%% SETUP
lam0=[1.5,2.1,3.4]; dt0=ones(size(lam0)); % rates and their durations
Nrep=1e3; lam=repmat(lam0,[1,Nrep]); dt=repmat(dt0,[1,Nrep]); % do replications (for stats check)

%% SIMULATION
L=cumsum([0,lam.*dt]); t=cumsum([0,dt]); % cumulative expected # events and time
Lmax=L(end); N=poissrnd(Lmax); % sample total # events
Lsmp=Lmax*sort(rand([1,N])); % sample event times (in "L space")
tsmp=interp1(L,t,Lsmp); % transform to "t space"

%% STATS CHECK
% "L space" waiting time CDF
dL=sort(diff(Lsmp)); p=(1:N-1)/N; % simulated
p0_L=1-exp(-dL); % exponential
h=plot(dL,p,'k',dL,p0_L,'r','LineWidth',1.5); set(h(1),'LineWidth',4);
axis tight; xlabel('dL'); legend('data','theory (exp)',4); title('L space CDF');

% "t space" waiting time CDF
dT=sort(diff(tsmp)); % simulated
wcmp=(lam0.*dt0)/(lam0*dt0'); pcmp=1-exp(-lam0'*dT); p0=wcmp*pcmp; % mixture
subplot(211); plot(dT,pcmp); ylabel('CDF'); title('Mixture Components'); axis tight;
legend(cellstr(num2str(lam0','lam = %0.1f ')),4);
subplot(212); h=plot(dT,p,'k',dT,p0,'r','LineWidth',1.5);  set(h(1),'LineWidth',4);
axis tight; xlabel('dt'); ylabel('CDF'); title('Aggregate');
legend('data','theory (exp mixture)',4);

% mean arrival rate
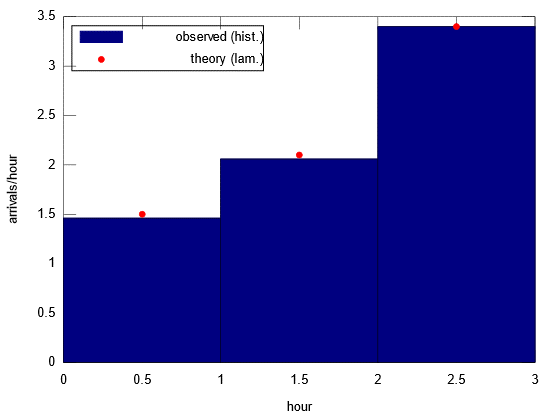
tbin=0.5:2.5; Navg=hist(mod(tsmp,3),tbin)/Nrep; bar(tbin,Navg,1);
hold on; plot(tbin,lam0,'r.'); hold off;
legend('observed (hist.)','theory (lam.)',0);
xlabel('hour'); ylabel('arrivals/hour');
As requested in the comments, here is an example of the simulated mean arrival rates (see also updated code above):


