Retag and changes in body
Source Link
Ferdi
  • 5.3k
  • 10
  • 47
  • 64

I am new to time series analysis and I am trying to model a time series. I know there are similar questions but I could not figure out the solution to my problem.

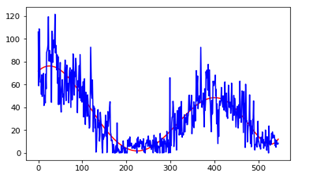
I have a time series like the one below (Blue color).

Time series with regression line fitted.

To remove the trend I fitted a polynomial curve of degree 6. As can be seen in the above picture with the red line. Then I took differences of actual to the fitted line to get the below figure (left).

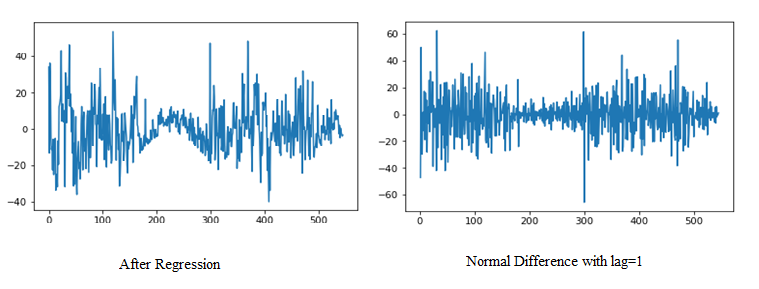
enter image description here

Similarly, to remove the trend (other way), I took difference of lag=1 for the original time series and I observed as above (right).

Then I carried out Dickey-Fuller test for both of them, I observed this.

  1. Regression Model

ADF Statistic: -9.50645, p-value: 0.000000

5%: -2.867 10%: -2.570 1%: -3.442

  1. Difference model.

ADF Statistic: -10.098328, p-value: 0.000000

5%: -2.867 10%: -2.570 1%: -3.443

The statistic for the above two says that the series is stationary. But, visually we can see both the observed series are not stationary. It has some volatility clusters after de-trending. I also tried differencing twice still I have same problem. How do I go with this? Should I have to do more preprocessing for forecasting or shall I use models like ARCH or GARCH to model the series for variance?

Any help is appreciated. Thanks.
I am new to time series analysis and I am trying to model a time series. I know there are similar questions but I could not figure out the solution to my problem.

I have a time series like the one below (Blue color).

Time series with regression line fitted.

To remove the trend I fitted a polynomial curve of degree 6. As can be seen in the above picture with the red line. Then I took differences of actual to the fitted line to get the below figure (left).

enter image description here

Similarly, to remove the trend (other way), I took difference of lag=1 for the original time series and I observed as above (right).

Then I carried out Dickey-Fuller test for both of them, I observed this.

  1. Regression Model

ADF Statistic: -9.50645, p-value: 0.000000

5%: -2.867 10%: -2.570 1%: -3.442

  1. Difference model.

ADF Statistic: -10.098328, p-value: 0.000000

5%: -2.867 10%: -2.570 1%: -3.443

The statistic for the above two says that the series is stationary. But, visually we can see both the observed series are not stationary. It has some volatility clusters after de-trending. I also tried differencing twice still I have same problem. How do I go with this? Should I have to do more preprocessing for forecasting or shall I use models like ARCH or GARCH to model the series for variance?

Source Link

How do I tell that my time series is stationary or not?

I am new to time series analysis and I am trying to model a time series. I know there are similar questions but I could not figure out the solution to my problem.

I have a time series like the one below (Blue color).

Time series with regression line fitted.

To remove the trend I fitted a polynomial curve of degree 6. As can be seen in the above picture with the red line. Then I took differences of actual to the fitted line to get the below figure (left).

enter image description here

Similarly, to remove the trend (other way), I took difference of lag=1 for the original time series and I observed as above (right).

Then I carried out Dickey-Fuller test for both of them, I observed this.

  1. Regression Model

ADF Statistic: -9.50645, p-value: 0.000000

5%: -2.867 10%: -2.570 1%: -3.442

  1. Difference model.

ADF Statistic: -10.098328, p-value: 0.000000

5%: -2.867 10%: -2.570 1%: -3.443

The statistic for the above two says that the series is stationary. But, visually we can see both the observed series are not stationary. It has some volatility clusters after de-trending. I also tried differencing twice still I have same problem. How do I go with this? Should I have to do more preprocessing for forecasting or shall I use models like ARCH or GARCH to model the series for variance?

Any help is appreciated. Thanks.