improved formatting
Source Link
Stefan
  • 6.6k
  • 1
  • 24
  • 45

I have run a glm to look at the effects of several environementalenvironmental variables (x variables) on the numbers of bacteria in a soil sample  (y variable):

sludgemodel <- glm(cfu.g ~ days + pH + temperature, family = gaussian (link=identity), na.action = na.exclude, data = sludgeqpcr)

sludgemodel <- glm(cfu.g ~ days + pH + temperature, family = gaussian (link=identity),
                   na.action = na.exclude, data = sludgeqpcr)

I then plotted the model to check the model assumptions:

plot(sludgemodel)

plot(sludgemodel)

The plots all look okay except the residuals vs fitted plot which does not have a random distribution but more of a curved distribution.

Should I transform the data or use a different error/link function? I am very new to R and statistics so advice would be appreciated.

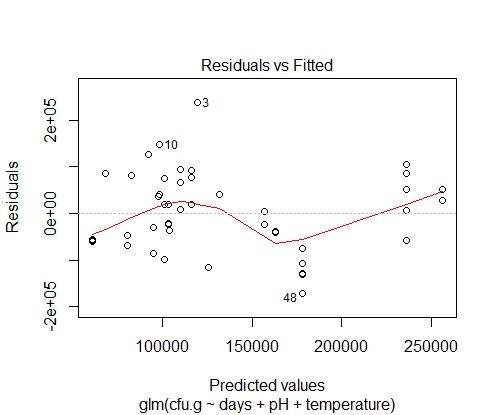
residuals v fitted plot

I have run a glm to look at the effects of several environemental variables (x variables) on the numbers of bacteria in a soil sample(y variable)

sludgemodel <- glm(cfu.g ~ days + pH + temperature, family = gaussian (link=identity), na.action = na.exclude, data = sludgeqpcr)

I then plotted the model to check the model assumptions

plot(sludgemodel)

The plots all look okay except the residuals vs fitted plot which does not have a random distribution but more of a curved distribution.

Should I transform the data or use a different error/link function? I am very new to R and statistics so advice would be appreciated.

residuals v fitted plot

I have run a glm to look at the effects of several environmental variables (x variables) on the numbers of bacteria in a soil sample  (y variable):

sludgemodel <- glm(cfu.g ~ days + pH + temperature, family = gaussian (link=identity),
                   na.action = na.exclude, data = sludgeqpcr)

I then plotted the model to check the model assumptions:

plot(sludgemodel)

The plots all look okay except the residuals vs fitted plot which does not have a random distribution but more of a curved distribution.

Should I transform the data or use a different error/link function? I am very new to R and statistics so advice would be appreciated.

residuals v fitted plot

Source Link
LC710
  • 11
  • 2

How to generate a glm with good residuals vs fitted

I have run a glm to look at the effects of several environemental variables (x variables) on the numbers of bacteria in a soil sample(y variable)

sludgemodel <- glm(cfu.g ~ days + pH + temperature, family = gaussian (link=identity), na.action = na.exclude, data = sludgeqpcr)

I then plotted the model to check the model assumptions

plot(sludgemodel)

The plots all look okay except the residuals vs fitted plot which does not have a random distribution but more of a curved distribution.

Should I transform the data or use a different error/link function? I am very new to R and statistics so advice would be appreciated.

residuals v fitted plot