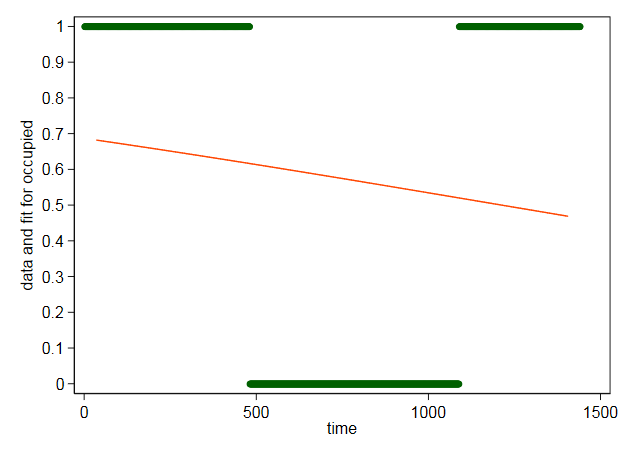
This is what I get with Stata for your data.
. logit occ time

Iteration 0:   log likelihood = -980.63877
Iteration 1:   log likelihood = -968.10592
Iteration 2:   log likelihood = -968.09925
Iteration 3:   log likelihood = -968.09925

Logistic regression                             Number of obs     =      1,440
                                                LR chi2(1)        =      25.08
                                                Prob > chi2       =     0.0000
Log likelihood = -968.09925                     Pseudo R2         =     0.0128

------------------------------------------------------------------------------
    occupied |      Coef.   Std. Err.      z    P>|z|     [95% Conf. Interval]
-------------+----------------------------------------------------------------
        time |   -.000648   .0001305    -4.97   0.000    -.0009037   -.0003923
       _cons |   .7861841   .1102782     7.13   0.000     .5700429    1.002325
------------------------------------------------------------------------------
We agree on the coefficients to the precision shown above, so your code looks good. I didn't ask Stata for more decimal places.
I don't see where 0.7287119626 comes from, however.
The real question is whether your results are surprising. A graph of the data resolves the puzzlement.

Logit regression can't be smarter than what you ask it to do. Here with just time as a predictor the best it can do is fit a monotonic curve, which for these data doesn't vary that much, as you report. In broad terms you have three blocks of points that vote in different ways. The 1s pull up the curve; the 0s pull it down. The first 480 points are 1s and the last 352 are 1s, so that asymmetry drives a discernible downward slope.
To get closer to the data you'd need more predictors (e.g. a quadratic would give you a turning point too), but it's hard to see why that would be interesting or useful in this case. The data are deterministic and defined by two steps at particular times. Logit regression can't get very close to that unless you tautologically use stepped predictors for the purpose.

