Bumped by Community user
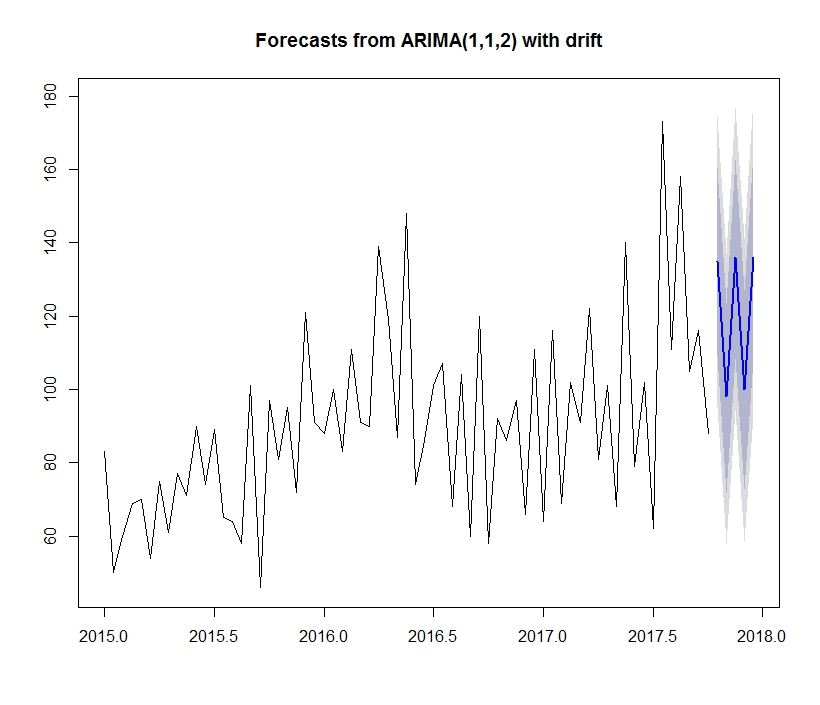
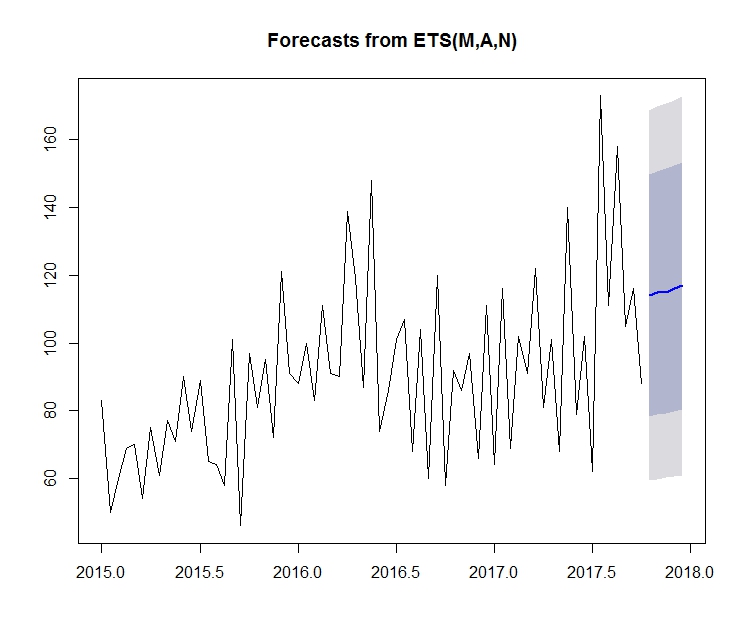
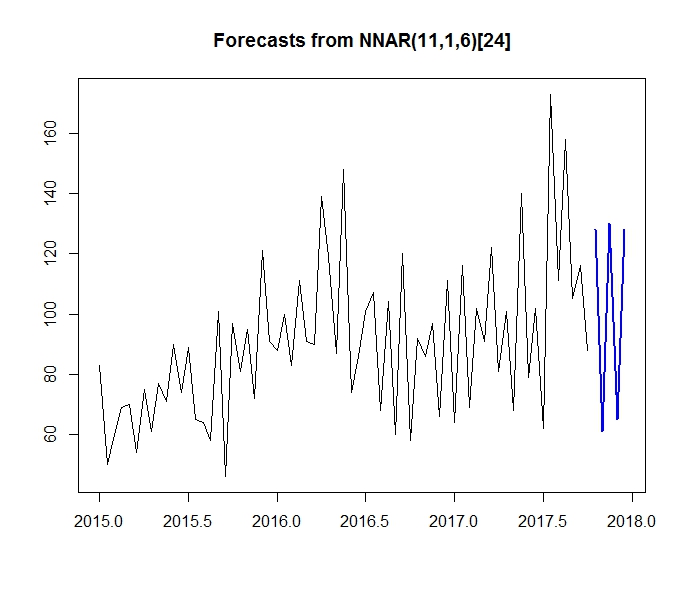
Adding screenshots and different forecasting methods outputs.
Source Link
nariver1
  • 121
  • 1
  • 7

I would like to share my analysis in order to have guidance on how to improve the time series results.

Here you will find a table comparing real values vs forecasted ones.

Table

Below you will find the code that generated that output (in R).

# Load required libraries
library(forecast)
library(lubridate)
library(tidyverse)
library(scales)
library(ggfortify)

# Load dataset
emea <- read.csv(file="C:/Users/nsoria/Google Drive/Trabajo/AMS Globales/812_Finanzas.csv", header=TRUE, sep=';', dec=",")

# Create time series object
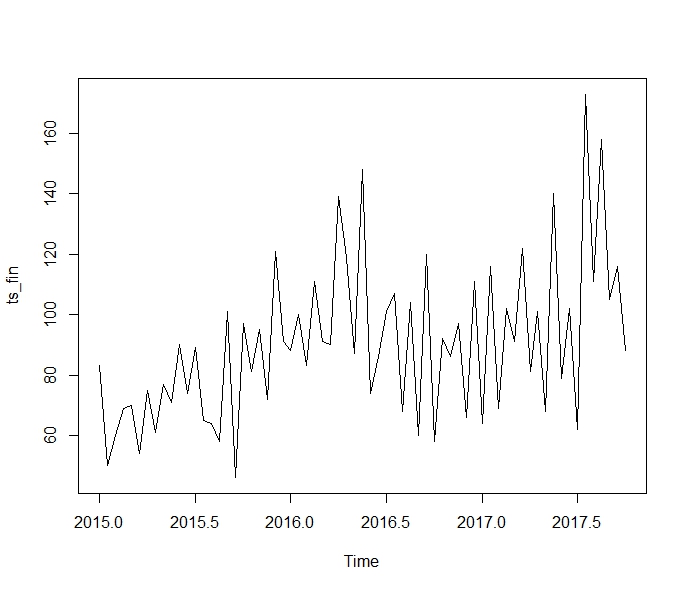
ts_fin <- ts(emea$Valor, deltat = 1/24, start = c(2015, 1))

# Pull out the seasonal, trend, and irregular components from the time series 
model <- stl(ts_fin, s.window = "periodic")

# Predict the next 3 bi weeks of tickets
pred <- forecast(model, h = 5)

# Round values to better accuracy
pred$mean <- round(pred$mean)
pred$upper <- round(pred$upper)
pred$lower <- round(pred$lower)

I have added in this link the dataset which is used here.

My main concern would be how to improve accuracy for forecasted results. I am looking into a possibility to add a machine learning algorithm but I am open to suggestions.

Thanks in advance.

Edit 24/01: As suggested, you will find the actual results for the prediction and the different outputs.

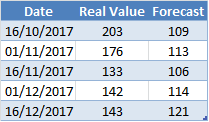
Real Values Auto Arima Forecast ETS Forecast NNar Forecast

I would like to share my analysis in order to have guidance on how to improve the time series results.

Here you will find a table comparing real values vs forecasted ones.

Table

Below you will find the code that generated that output (in R).

# Load required libraries
library(forecast)
library(lubridate)
library(tidyverse)
library(scales)
library(ggfortify)

# Load dataset
emea <- read.csv(file="C:/Users/nsoria/Google Drive/Trabajo/AMS Globales/812_Finanzas.csv", header=TRUE, sep=';', dec=",")

# Create time series object
ts_fin <- ts(emea$Valor, deltat = 1/24, start = c(2015, 1))

# Pull out the seasonal, trend, and irregular components from the time series 
model <- stl(ts_fin, s.window = "periodic")

# Predict the next 3 bi weeks of tickets
pred <- forecast(model, h = 5)

# Round values to better accuracy
pred$mean <- round(pred$mean)
pred$upper <- round(pred$upper)
pred$lower <- round(pred$lower)

I have added in this link the dataset which is used here.

My main concern would be how to improve accuracy for forecasted results. I am looking into a possibility to add a machine learning algorithm but I am open to suggestions.

Thanks in advance.

Edit 24/01: As suggested, you will find the actual results for the prediction and the different outputs.
Real Values Auto Arima Forecast ETS Forecast NNar Forecast

Source Link
nariver1
  • 121
  • 1
  • 7

How to improve results accuracy for time series forecast?

I would like to share my analysis in order to have guidance on how to improve the time series results.

Here you will find a table comparing real values vs forecasted ones.

Table

Below you will find the code that generated that output (in R).

# Load required libraries
library(forecast)
library(lubridate)
library(tidyverse)
library(scales)
library(ggfortify)

# Load dataset
emea <- read.csv(file="C:/Users/nsoria/Google Drive/Trabajo/AMS Globales/812_Finanzas.csv", header=TRUE, sep=';', dec=",")

# Create time series object
ts_fin <- ts(emea$Valor, deltat = 1/24, start = c(2015, 1))

# Pull out the seasonal, trend, and irregular components from the time series 
model <- stl(ts_fin, s.window = "periodic")

# Predict the next 3 bi weeks of tickets
pred <- forecast(model, h = 5)

# Round values to better accuracy
pred$mean <- round(pred$mean)
pred$upper <- round(pred$upper)
pred$lower <- round(pred$lower)

I have added in this link the dataset which is used here.

My main concern would be how to improve accuracy for forecasted results. I am looking into a possibility to add a machine learning algorithm but I am open to suggestions.

Thanks in advance.