added 4 characters in body; added 2 characters in body
Source Link
ttnphns
  • 58.8k
  • 53
  • 287
  • 512

It seems that on some its subrange your dependent variable is constant or is exactly linearly dependent on the predictor(s). Let's have two correlated variables, X and Y (Y is dependent). The scatterplot is on the left.   

enter image description here

Let's return, as example, on the first ("constant") possibility. Recode all Y values from lowest to -0.5 to a single value -1 (see picture in the centre). Regress Y on X and plot residuals scatter, that is, rotate the central picture so that the prediction line is horizontal now. Does it resemble your picture?

It seems that on some its subrange your dependent variable is constant or is exactly linearly dependent on predictor(s). Let's have two correlated variables, X and Y (Y is dependent). The scatterplot is on the left.  enter image description here

Let's return, as example, on the first ("constant") possibility. Recode all Y values from lowest to -0.5 to a single value -1 (see picture in the centre). Regress Y on X and plot residuals scatter, that is, rotate the central picture so that the prediction line is horizontal now. Does it resemble your picture?

It seems that on some its subrange your dependent variable is constant or is exactly linearly dependent on the predictor(s). Let's have two correlated variables, X and Y (Y is dependent). The scatterplot is on the left. 

enter image description here

Let's return, as example, on the first ("constant") possibility. Recode all Y values from lowest to -0.5 to a single value -1 (see picture in the centre). Regress Y on X and plot residuals scatter, that is, rotate the central picture so that the prediction line is horizontal now. Does it resemble your picture?

added 60 characters in body; deleted 4 characters in body
Source Link
ttnphns
  • 58.8k
  • 53
  • 287
  • 512

IIt seems that on some its subrange your dependent variable is constant oror is exactly linearly dependent on predictor(s). Let's have two correlated variables, X and Y (Y is dependent). The scatterplot is on the left.
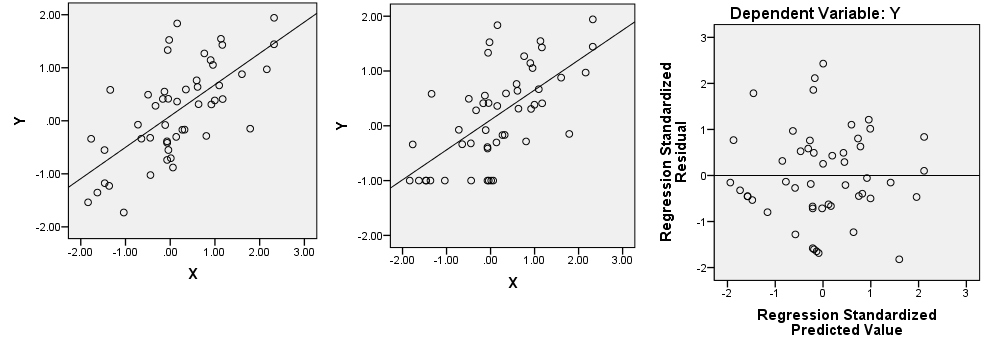
   enter image description here

Then recodeLet's return, as example, on the first ("constant") possibility. Recode all Y values from lowest to -0.5 to a single value -1 (see picture in the centre). Finally, regressRegress Y on X and plot residuals scatter, that is, rotate the central picture so that the prediction line is horizontal now. Does it resemble your picture?

I seems that on some its subrange your dependent variable is constant or is exactly linearly dependent on predictor(s). Let's have two correlated variables, X and Y (Y is dependent). The scatterplot is on the left.

 enter image description here

Then recode all Y values from lowest to -0.5 to a single value -1 (see picture in the centre). Finally, regress Y on X and plot residuals scatter, that is, rotate the central picture so that the prediction line is horizontal. Does it resemble your picture?

It seems that on some its subrange your dependent variable is constant or is exactly linearly dependent on predictor(s). Let's have two correlated variables, X and Y (Y is dependent). The scatterplot is on the left.  enter image description here

Let's return, as example, on the first ("constant") possibility. Recode all Y values from lowest to -0.5 to a single value -1 (see picture in the centre). Regress Y on X and plot residuals scatter, that is, rotate the central picture so that the prediction line is horizontal now. Does it resemble your picture?

edited body
Source Link
ttnphns
  • 58.8k
  • 53
  • 287
  • 512

I seems that on some its subrange your dependent variable is constant or is exactly linearly dependent on predictor(s). Let's have two correlated variables, X and Y (Y is dependent). The scatterplot is on the left.

enter image description here

Then recode all Y values from lowest to -10.5 to a single value -1 (see picture in the centre). Finally, regress Y on X and plot residuals scatter, that is, rotate the central picture so that the prediction line is horizontal. Does it resemble your picture?

I seems that on some its subrange your dependent variable is constant or is exactly linearly dependent on predictor(s). Let's have two correlated variables, X and Y (Y is dependent). The scatterplot is on the left.

enter image description here

Then recode all Y values from lowest to -1.5 to a single value -1 (see picture in the centre). Finally, regress Y on X and plot residuals scatter, that is, rotate the central picture so that the prediction line is horizontal. Does it resemble your picture?

I seems that on some its subrange your dependent variable is constant or is exactly linearly dependent on predictor(s). Let's have two correlated variables, X and Y (Y is dependent). The scatterplot is on the left.

enter image description here

Then recode all Y values from lowest to -0.5 to a single value -1 (see picture in the centre). Finally, regress Y on X and plot residuals scatter, that is, rotate the central picture so that the prediction line is horizontal. Does it resemble your picture?

Source Link
ttnphns
  • 58.8k
  • 53
  • 287
  • 512
Loading