Post Undeleted by Sextus Empiricus
Post Deleted by Sextus Empiricus
Commonmark migration
Source Link
  • This occurs when we select for a given $X$ a confidence interval for $\theta$ (based on $L(x)$ and $U(x)$) such that $X$ occurs in a fraction $1-\alpha$ of all the possible cases of $\theta$ in the confidence interval (based on $L(\theta)$ and $U(\theta)$). There is some degree of freedom in shifting more or less weight between $U$ and $L$ and there are many different ways to do this.

    This occurs when we select for a given $X$ a confidence interval for $\theta$ (based on $L(x)$ and $U(x)$) such that $X$ occurs in a fraction $1-\alpha$ of all the possible cases of $\theta$ in the confidence interval (based on $L(\theta)$ and $U(\theta)$). There is some degree of freedom in shifting more or less weight between $U$ and $L$ and there are many different ways to do this.

  • If we do this consistently every-time that we perform an experiment, then in a fraction $1-\alpha$ of the cases we will observe an $X$ that let's us include the true $\theta$ inside the interval and in a fraction $\alpha$ of the cases we will not include $\theta$ inside the interval.

    If we do this consistently every-time that we perform an experiment, then in a fraction $1-\alpha$ of the cases we will observe an $X$ that let's us include the true $\theta$ inside the interval and in a fraction $\alpha$ of the cases we will not include $\theta$ inside the interval.

    (this is depicted in the image by the colored lines for the case $\theta=0.2$, the gray lines are cases when we select the right interval, the red when the interval is too high and the green when the interval is too low.)

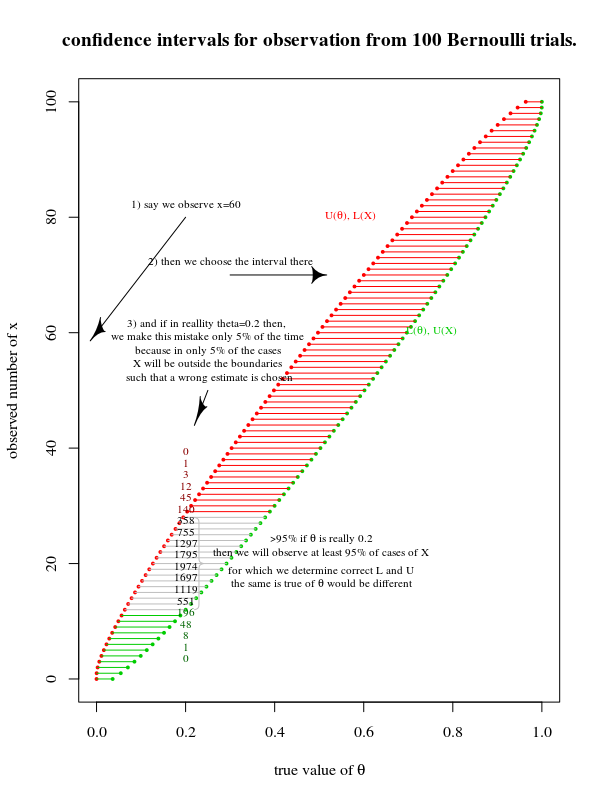
(this is depicted in the image by the colored lines for the case $\theta=0.2$, the gray lines are cases when we select the right interval, the red when the interval is too high and the green when the interval is too low.)

  • This occurs when we select for a given $X$ a confidence interval for $\theta$ (based on $L(x)$ and $U(x)$) such that $X$ occurs in a fraction $1-\alpha$ of all the possible cases of $\theta$ in the confidence interval (based on $L(\theta)$ and $U(\theta)$). There is some degree of freedom in shifting more or less weight between $U$ and $L$ and there are many different ways to do this.
  • If we do this consistently every-time that we perform an experiment, then in a fraction $1-\alpha$ of the cases we will observe an $X$ that let's us include the true $\theta$ inside the interval and in a fraction $\alpha$ of the cases we will not include $\theta$ inside the interval.

(this is depicted in the image by the colored lines for the case $\theta=0.2$, the gray lines are cases when we select the right interval, the red when the interval is too high and the green when the interval is too low.)

  • This occurs when we select for a given $X$ a confidence interval for $\theta$ (based on $L(x)$ and $U(x)$) such that $X$ occurs in a fraction $1-\alpha$ of all the possible cases of $\theta$ in the confidence interval (based on $L(\theta)$ and $U(\theta)$). There is some degree of freedom in shifting more or less weight between $U$ and $L$ and there are many different ways to do this.

  • If we do this consistently every-time that we perform an experiment, then in a fraction $1-\alpha$ of the cases we will observe an $X$ that let's us include the true $\theta$ inside the interval and in a fraction $\alpha$ of the cases we will not include $\theta$ inside the interval.

    (this is depicted in the image by the colored lines for the case $\theta=0.2$, the gray lines are cases when we select the right interval, the red when the interval is too high and the green when the interval is too low.)

Bounty Ended with 100 reputation awarded by gioxc88
added 20 characters in body
Source Link
Sextus Empiricus
  • 86.5k
  • 6
  • 115
  • 302

Possibly a Clopper-Pearson interval may help to obtain an intuition about these confidence intervals. (the below is a variation of an answer to How to estimate a probability of an event to occur based on its count? more specifically it is a variation of a graph from Clopper-Pearson )

The main trick here is that we can switch L and U from being functions of X to being functions of $\mathbb{\theta}$

Imagine the case of 100 Bernoulli trials where the probability of success is $\theta$ and we observe the total number of successes $X$.

fiducial probability

When we observe an $X$ as if it came from the unknown population of Bernoulli trials with true (unknown) probability $\theta$ then we will choose $U(X)$ and $L(X)$ such that no matter what the the real $\theta$ the probability to make a mistake is $\alpha$ in estimating $U(X)$ and L(X).

  • This occurs when we select for a given $X$ a confidence interval for $\theta$ (based on $L(x)$ and $U(x)$) such that $X$ occurs in a fraction $1-\alpha$ of all the possible cases of $\theta$ in the confidence interval (based on $L(\theta)$ and $U(\theta)$). There is some degree of freedom in shifting more or less weight between $U$ and $L$ and there are many different ways to do this.
  • If we do this consistently every-time that we perform an experiment, then in a fraction $1-\alpha$ of the cases we will observe an $X$ that let's us include the true $\theta$ inside the interval and in a fraction $\alpha$ of the cases we will not include $\theta$ inside the interval.

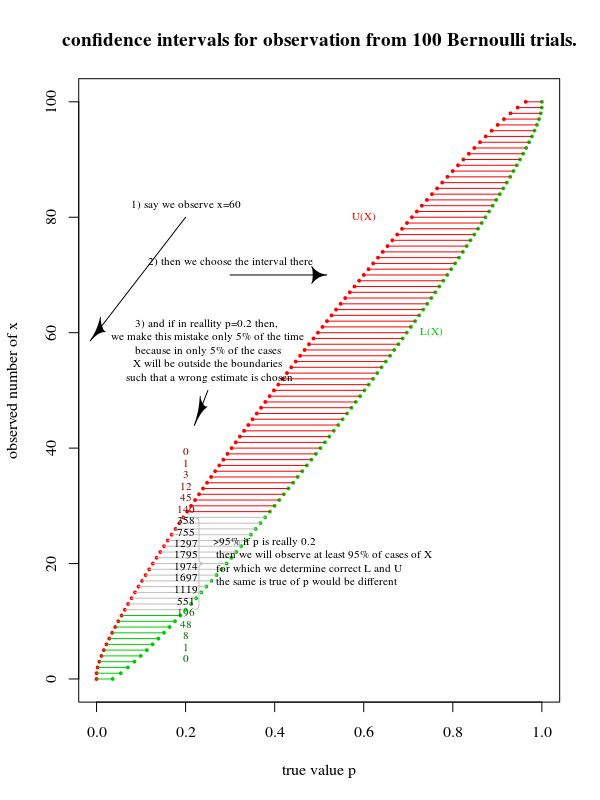
(this is depicted in the image by the colored lines for the case $\theta=0.2$, the gray lines are cases when we select the right interval, the red when the interval is too high and the green when the interval is too low.)


 

$$-----------------------------------$$

More formally:

if we choose a confidence interval such that

$$I_{\alpha}(X) = \lbrace \theta: F_X(\alpha/2,\theta) \leq X \leq F_X(1-\alpha/2,\theta) \rbrace$$

then we have a $1-\alpha$ confidence interval.

The above means that we choose, for a given observation $x$, those $\theta$ into the interval for which the observation $x$ would occur within a $1-\alpha$ interval $P( L<x<U \vert \theta) = 1-\alpha$, where the $L$ and $U$ are now functions of $\theta$.

Then given any real $\theta$ we will observe:

  • a fraction $1 - \alpha$ of the time an $X$ such that $$F_X(\alpha/2,\theta) \leq X \leq F_X(1-\alpha/2,\theta)$$
  • and a fraction $\alpha$ of the time an $X$ such that $$X < F_X(\alpha/2,\theta) \text{ or } X > F_X(1-\alpha/2,\theta)$$

If you like you could write out the $f_{L,U|\theta}$ which relates to $f_{X|\theta}$ and L(X) and U(X) (both L(X) and U(X), both functions of X, are indeed correlated). 

But the figure above already shows enough, e.g. if $\theta=0.20$ then in 0+1+3+12+45+140 cases the $\theta<L(X)$ and in 196+48+8+1+0 cases the $\theta>U(x)$$\theta>U(X)$ while in 358+755+1297+1795+1974+1697+1119+551 cases $L(X) \leq \theta \leq U(x)$$L(X) \leq \theta \leq U(X)$


$$-----------------------------------$$

If the shape of $x_U=U(\theta)$ and $x_L=L(\theta)$ is convex (like in the figure above), then we can use the inverses of those functions.

Possibly a Clopper-Pearson interval may help to obtain an intuition about these confidence intervals. (the below is a variation of an answer to How to estimate a probability of an event to occur based on its count? more specifically it is a variation of a graph from Clopper-Pearson )

The main trick here is that we can switch L and U from being functions of X to being functions of $\mathbb{\theta}$

Imagine the case of 100 Bernoulli trials where the probability of success is $\theta$ and we observe the total number of successes $X$.

fiducial probability

When we observe an $X$ as if it came from the unknown population of Bernoulli trials with true (unknown) probability $\theta$ then we will choose $U(X)$ and $L(X)$ such that no matter what the the real $\theta$ the probability to make a mistake is $\alpha$ in estimating $U(X)$ and L(X).

  • This occurs when we select for a given $X$ a confidence interval for $\theta$ (based on $L(x)$ and $U(x)$) such that $X$ occurs in a fraction $1-\alpha$ of all the possible cases of $\theta$ in the confidence interval (based on $L(\theta)$ and $U(\theta)$). There is some degree of freedom in shifting more or less weight between $U$ and $L$ and there are many different ways to do this.
  • If we do this consistently every-time that we perform an experiment, then in a fraction $1-\alpha$ of the cases we will observe an $X$ that let's us include the true $\theta$ inside the interval and in a fraction $\alpha$ of the cases we will not include $\theta$ inside the interval.

(this is depicted in the image by the colored lines for the case $\theta=0.2$, the gray lines are cases when we select the right interval, the red when the interval is too high and the green when the interval is too low.)


More formally:

if we choose a confidence interval such that

$$I_{\alpha}(X) = \lbrace \theta: F_X(\alpha/2,\theta) \leq X \leq F_X(1-\alpha/2,\theta) \rbrace$$

then we have a $1-\alpha$ confidence interval.

The above means that we choose, for a given observation $x$, those $\theta$ into the interval for which the observation $x$ would occur within a $1-\alpha$ interval $P( L<x<U \vert \theta) = 1-\alpha$, where the $L$ and $U$ are now functions of $\theta$.

Then given any real $\theta$ we will observe:

  • a fraction $1 - \alpha$ of the time an $X$ such that $$F_X(\alpha/2,\theta) \leq X \leq F_X(1-\alpha/2,\theta)$$
  • and a fraction $\alpha$ of the time an $X$ such that $$X < F_X(\alpha/2,\theta) \text{ or } X > F_X(1-\alpha/2,\theta)$$

If you like you could write out the $f_{L,U|\theta}$ which relates to $f_{X|\theta}$ and L(X) and U(X), both functions of X, are indeed correlated. But the figure above already shows enough, e.g. if $\theta=0.20$ then in 0+1+3+12+45+140 cases the $\theta<L(X)$ and in 196+48+8+1+0 cases the $\theta>U(x)$ while in 358+755+1297+1795+1974+1697+1119+551 cases $L(X) \leq \theta \leq U(x)$


If the shape of $x_U=U(\theta)$ and $x_L=L(\theta)$ is convex (like in the figure above), then we can use the inverses of those functions.

Possibly a Clopper-Pearson interval may help to obtain an intuition about these confidence intervals. (the below is a variation of an answer to How to estimate a probability of an event to occur based on its count? more specifically it is a variation of a graph from Clopper-Pearson )

The main trick here is that we can switch L and U from being functions of X to being functions of $\mathbb{\theta}$

Imagine the case of 100 Bernoulli trials where the probability of success is $\theta$ and we observe the total number of successes $X$.

fiducial probability

When we observe an $X$ as if it came from the unknown population of Bernoulli trials with true (unknown) probability $\theta$ then we will choose $U(X)$ and $L(X)$ such that no matter what the the real $\theta$ the probability to make a mistake is $\alpha$ in estimating $U(X)$ and L(X).

  • This occurs when we select for a given $X$ a confidence interval for $\theta$ (based on $L(x)$ and $U(x)$) such that $X$ occurs in a fraction $1-\alpha$ of all the possible cases of $\theta$ in the confidence interval (based on $L(\theta)$ and $U(\theta)$). There is some degree of freedom in shifting more or less weight between $U$ and $L$ and there are many different ways to do this.
  • If we do this consistently every-time that we perform an experiment, then in a fraction $1-\alpha$ of the cases we will observe an $X$ that let's us include the true $\theta$ inside the interval and in a fraction $\alpha$ of the cases we will not include $\theta$ inside the interval.

(this is depicted in the image by the colored lines for the case $\theta=0.2$, the gray lines are cases when we select the right interval, the red when the interval is too high and the green when the interval is too low.)

$$-----------------------------------$$

More formally:

if we choose a confidence interval such that

$$I_{\alpha}(X) = \lbrace \theta: F_X(\alpha/2,\theta) \leq X \leq F_X(1-\alpha/2,\theta) \rbrace$$

then we have a $1-\alpha$ confidence interval.

The above means that we choose, for a given observation $x$, those $\theta$ into the interval for which the observation $x$ would occur within a $1-\alpha$ interval $P( L<x<U \vert \theta) = 1-\alpha$, where the $L$ and $U$ are now functions of $\theta$.

Then given any real $\theta$ we will observe:

  • a fraction $1 - \alpha$ of the time an $X$ such that $$F_X(\alpha/2,\theta) \leq X \leq F_X(1-\alpha/2,\theta)$$
  • and a fraction $\alpha$ of the time an $X$ such that $$X < F_X(\alpha/2,\theta) \text{ or } X > F_X(1-\alpha/2,\theta)$$

If you like you could write out the $f_{L,U|\theta}$ which relates to $f_{X|\theta}$ and L(X) and U(X) (both L(X) and U(X), functions of X, are indeed correlated). 

But the figure above already shows enough, e.g. if $\theta=0.20$ then in 0+1+3+12+45+140 cases the $\theta<L(X)$ and in 196+48+8+1+0 cases the $\theta>U(X)$ while in 358+755+1297+1795+1974+1697+1119+551 cases $L(X) \leq \theta \leq U(X)$

$$-----------------------------------$$

If the shape of $x_U=U(\theta)$ and $x_L=L(\theta)$ is convex (like in the figure above), then we can use the inverses of those functions.

deleted 86 characters in body
Source Link
Sextus Empiricus
  • 86.5k
  • 6
  • 115
  • 302

Possibly a Clopper-Pearson interval may help to obtain an intuition about these confidence intervals. (the below is a variation of an answer to How to estimate a probability of an event to occur based on its count? more specifically it is a variation of a graph from Clopper-Pearson )

The main trick here is that we can switch L and U from being functions of X to being functions of $\mathbb{\theta}$ (or $\theta=p$ in the particular case of Bernoulli trials, that is used in this answer)

Imagine the case of 100 Bernoulli trials where the probability of success is $p$$\theta$ and we observe the total number of successes $X$.

fiducial probabilityfiducial probability

When we observe an $X$ as if it came from the unknown population of Bernoulli trials with true (unknown) probability $p$$\theta$ then we will choose $U(X)$ and $L(X)$ such that no matter what the the real $p$ (or $\theta$) the probability to make a mistake is $\alpha$ in estimating $U(X)$ and L(X).

  • This occurs when we select for a given $X$ a confidence interval for $p$$\theta$ (based on $L(x)$ and $U(x)$) such that $X$ occurs in a fraction $1-\alpha$ of all the possible cases of $p$$\theta$ in the confidence interval (based on $L(p)$$L(\theta)$ and $U(p)$$U(\theta)$). There is some degree of freedom in shifting more or less weight between $U$ and $L$ and there are many different ways to do this.
  • If we do this consistently every-time that we perform an experiment, then in a fraction $1-\alpha$ of the cases we will observe an $X$ that let's us include the true $p$$\theta$ inside the interval and in a fraction $\alpha$ of the cases we will not include $p$$\theta$ inside the interval.

(this is depicted in the image by the colored lines for the case $p=0.2$$\theta=0.2$, the gray lines are cases when we select the right interval, the red when the interval is too high and the green when the interval is too low.)


More formally:

if we choose a confidence interval such that

$$I_{\alpha}(X) = \lbrace \theta: F_X(\alpha/2,\theta) \leq X \leq F_X(1-\alpha/2,\theta) \rbrace$$

then we have a $1-\alpha$ confidence interval.

The above means that we choose, for a given observation $x$, those $\theta$ into the interval for which the observation occurs$x$ would occur within a $1-\alpha$ interval $P( L<x<U \vert \theta) = 1-\alpha$, in whichwhere the $L$ and $U$ are now functions of $\theta$ (or $p$).

Then given any real $\theta$ or $p$ we will observe:

  • a fraction $1 - \alpha$ of the time an $X$ such that $$F_X(\alpha/2,\theta) \leq X \leq F_X(1-\alpha/2,\theta)$$
  • and a fraction $\alpha$ of the time an $X$ such that $$X < F_X(\alpha/2,\theta) \text{ or } X > F_X(1-\alpha/2,\theta)$$

If you like you could write out the $f_{L,U|\theta}$ which relates to $f_{X|\theta}$ and L(X) and U(X), both functions of X, are indeed correlated. But the figure above already shows enough, e.g. if p=20$\theta=0.20$ then in 0+1+3+12+45+140 cases the $\theta<L(X)$ and in 196+48+8+1+0 cases the $\theta>U(x)$ while in 358+755+1297+1795+1974+1697+1119+551 cases $L(X) \leq \theta \leq U(x)$


If the shape of $x_U=U(\theta)$ and $x_L=L(\theta)$ is convex (like in the figure above), then we can use the inverses of those functions.

Possibly a Clopper-Pearson interval may help to obtain an intuition about these confidence intervals. (the below is a variation of an answer to How to estimate a probability of an event to occur based on its count? more specifically it is a variation of a graph from Clopper-Pearson )

The main trick here is that we can switch L and U from being functions of X to being functions of $\mathbb{\theta}$ (or $\theta=p$ in the particular case of Bernoulli trials, that is used in this answer)

Imagine the case of 100 Bernoulli trials where the probability of success is $p$ and we observe the total number of successes $X$.

fiducial probability

When we observe an $X$ as if it came from the unknown population of Bernoulli trials with true probability $p$ then we will choose $U(X)$ and $L(X)$ such that no matter what the the real $p$ (or $\theta$) the probability to make a mistake is $\alpha$ in estimating $U(X)$ and L(X).

  • This occurs when we select for a given $X$ a confidence interval for $p$ (based on $L(x)$ and $U(x)$) such that $X$ occurs in a fraction $1-\alpha$ of all the cases of $p$ in the confidence interval (based on $L(p)$ and $U(p)$). There is some degree of freedom in shifting more or less weight between $U$ and $L$ and there are many different ways to do this.
  • If we do this consistently every-time that we perform an experiment, then in a fraction $1-\alpha$ of the cases we will observe an $X$ that let's us include the true $p$ inside the interval and in a fraction $\alpha$ of the cases we will not include $p$ inside the interval.

(this is depicted in the image by the colored lines for the case $p=0.2$, the gray lines are cases when we select the right interval, the red when the interval is too high and the green when the interval is too low.)


More formally:

if we choose a confidence interval such that

$$I_{\alpha}(X) = \lbrace \theta: F_X(\alpha/2,\theta) \leq X \leq F_X(1-\alpha/2,\theta) \rbrace$$

then we have a $1-\alpha$ confidence interval.

The above means that we choose, for a given observation $x$, those $\theta$ into the interval for which the observation occurs within a $1-\alpha$ interval $P( L<x<U \vert \theta) = 1-\alpha$, in which the $L$ and $U$ are now functions of $\theta$ (or $p$).

Then given any real $\theta$ or $p$ we will observe:

  • a fraction $1 - \alpha$ of the time an $X$ such that $$F_X(\alpha/2,\theta) \leq X \leq F_X(1-\alpha/2,\theta)$$
  • and a fraction $\alpha$ of the time an $X$ such that $$X < F_X(\alpha/2,\theta) \text{ or } X > F_X(1-\alpha/2,\theta)$$

If you like you could write out the $f_{L,U|\theta}$ which relates to $f_{X|\theta}$ and L(X) and U(X), both functions of X, are indeed correlated. But the figure above already shows enough, e.g. if p=20 then in 0+1+3+12+45+140 cases the $\theta<L(X)$ and in 196+48+8+1+0 cases the $\theta>U(x)$ while in 358+755+1297+1795+1974+1697+1119+551 cases $L(X) \leq \theta \leq U(x)$


If the shape of $x_U=U(\theta)$ and $x_L=L(\theta)$ is convex (like in the figure above), then we can use the inverses of those functions.

Possibly a Clopper-Pearson interval may help to obtain an intuition about these confidence intervals. (the below is a variation of an answer to How to estimate a probability of an event to occur based on its count? more specifically it is a variation of a graph from Clopper-Pearson )

The main trick here is that we can switch L and U from being functions of X to being functions of $\mathbb{\theta}$

Imagine the case of 100 Bernoulli trials where the probability of success is $\theta$ and we observe the total number of successes $X$.

fiducial probability

When we observe an $X$ as if it came from the unknown population of Bernoulli trials with true (unknown) probability $\theta$ then we will choose $U(X)$ and $L(X)$ such that no matter what the the real $\theta$ the probability to make a mistake is $\alpha$ in estimating $U(X)$ and L(X).

  • This occurs when we select for a given $X$ a confidence interval for $\theta$ (based on $L(x)$ and $U(x)$) such that $X$ occurs in a fraction $1-\alpha$ of all the possible cases of $\theta$ in the confidence interval (based on $L(\theta)$ and $U(\theta)$). There is some degree of freedom in shifting more or less weight between $U$ and $L$ and there are many different ways to do this.
  • If we do this consistently every-time that we perform an experiment, then in a fraction $1-\alpha$ of the cases we will observe an $X$ that let's us include the true $\theta$ inside the interval and in a fraction $\alpha$ of the cases we will not include $\theta$ inside the interval.

(this is depicted in the image by the colored lines for the case $\theta=0.2$, the gray lines are cases when we select the right interval, the red when the interval is too high and the green when the interval is too low.)


More formally:

if we choose a confidence interval such that

$$I_{\alpha}(X) = \lbrace \theta: F_X(\alpha/2,\theta) \leq X \leq F_X(1-\alpha/2,\theta) \rbrace$$

then we have a $1-\alpha$ confidence interval.

The above means that we choose, for a given observation $x$, those $\theta$ into the interval for which the observation $x$ would occur within a $1-\alpha$ interval $P( L<x<U \vert \theta) = 1-\alpha$, where the $L$ and $U$ are now functions of $\theta$.

Then given any real $\theta$ we will observe:

  • a fraction $1 - \alpha$ of the time an $X$ such that $$F_X(\alpha/2,\theta) \leq X \leq F_X(1-\alpha/2,\theta)$$
  • and a fraction $\alpha$ of the time an $X$ such that $$X < F_X(\alpha/2,\theta) \text{ or } X > F_X(1-\alpha/2,\theta)$$

If you like you could write out the $f_{L,U|\theta}$ which relates to $f_{X|\theta}$ and L(X) and U(X), both functions of X, are indeed correlated. But the figure above already shows enough, e.g. if $\theta=0.20$ then in 0+1+3+12+45+140 cases the $\theta<L(X)$ and in 196+48+8+1+0 cases the $\theta>U(x)$ while in 358+755+1297+1795+1974+1697+1119+551 cases $L(X) \leq \theta \leq U(x)$


If the shape of $x_U=U(\theta)$ and $x_L=L(\theta)$ is convex (like in the figure above), then we can use the inverses of those functions.

added 380 characters in body
Source Link
Sextus Empiricus
  • 86.5k
  • 6
  • 115
  • 302
Loading
Source Link
Sextus Empiricus
  • 86.5k
  • 6
  • 115
  • 302
Loading