added 102 characters in body
Source Link
thecity2
  • 2k
  • 2
  • 18
  • 25

So I gave this a go and found that I could use a kernel density estimator to calculate smooth pdf for the two populations. I can do this for each feature and then rank test points by summing the log likelihoods for each feature. I imagine this could theoretically work well if the smoothing is chosen using cross-validation and there is enough "weirdness" in the distributions that simpler linear classifiers don't capture.

Edit: I came to the realization that this is essentially Naive Bayes with non-parametric features.

distributions

For reference: https://stephens999.github.io/fiveMinuteStats/likelihood_ratio_simple_continuous_data.html

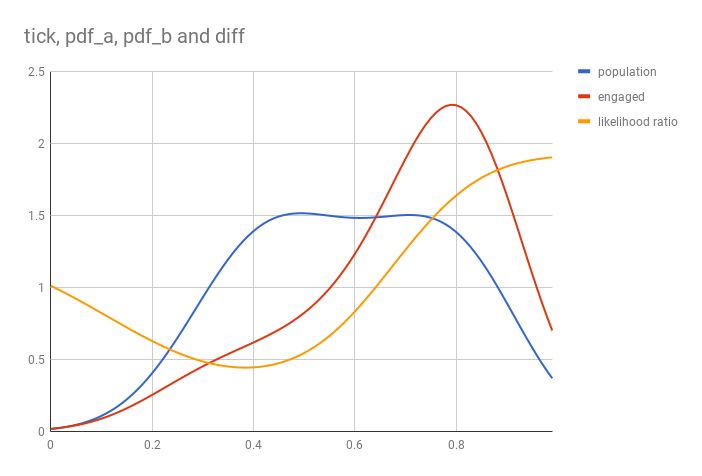
So I gave this a go and found that I could use a kernel density estimator to calculate smooth pdf for the two populations. I can do this for each feature and then rank test points by summing the log likelihoods for each feature. I imagine this could theoretically work well if the smoothing is chosen using cross-validation and there is enough "weirdness" in the distributions that simpler linear classifiers don't capture.

Edit: I came to the realization that this is essentially Naive Bayes with non-parametric features.

distributions

For reference: https://stephens999.github.io/fiveMinuteStats/likelihood_ratio_simple_continuous_data.html

added reference blog post
Source Link
thecity2
  • 2k
  • 2
  • 18
  • 25

So I gave this a go and found that I could use a kernel density estimator to calculate smooth pdf for the two populations. I can do this for each feature and then rank test points by summing the log likelihoods for each feature. I imagine this could theoretically work well if the smoothing is chosen using cross-validation and there is enough "weirdness" in the distributions that simpler linear classifiers don't capture.

distributions

For reference: https://stephens999.github.io/fiveMinuteStats/likelihood_ratio_simple_continuous_data.html

So I gave this a go and found that I could use a kernel density estimator to calculate smooth pdf for the two populations. I can do this for each feature and then rank test points by summing the log likelihoods for each feature. I imagine this could theoretically work well if the smoothing is chosen using cross-validation and there is enough "weirdness" in the distributions that simpler linear classifiers don't capture.

distributions

For reference: https://stephens999.github.io/fiveMinuteStats/likelihood_ratio_simple_continuous_data.html

Source Link
thecity2
  • 2k
  • 2
  • 18
  • 25

So I gave this a go and found that I could use a kernel density estimator to calculate smooth pdf for the two populations. I can do this for each feature and then rank test points by summing the log likelihoods for each feature. I imagine this could theoretically work well if the smoothing is chosen using cross-validation and there is enough "weirdness" in the distributions that simpler linear classifiers don't capture.

distributions