Changed 'type II' to 'type III', pretty crucial error :-)
Source Link
Matherion
  • 487
  • 5
  • 13

In regression analysis, predictors sometimes correlate (and in my field, psychology, they always do; often because they are simply measurements of the same aspects of human psychology).

If predictors correlate in their prediction of the criterion (the dependent variable), this means that the sums of squares (SS) of the criterion cannot be cleanly partitioned between predictors. There are different ways to decide how to deal with this 'overlapping' SS. Most software programs by default use Type IIIII SS, which means that the overlapping SS is 'thrown away', as explained in question "https://stats.stackexchange.com/questions/24827/where-is-the-shared-variance-between-all-ivs-in-a-linear-multiple-regression-equ?noredirect=1&lq=1".

However. It's not really thrown away, is it?

Because all SS, including the overlapping region, is included in the proportion of explained variance ($R^2$) which is equal to:

$$R^2 = r_{y\hat{y}}^2$$

And:

$$\hat{y} = \beta_0 + \beta_1 x_1 + \beta_2 x_2$$

So necessarily the regression coefficients do somehow 'get' some of the overlapping SS - in fact, between them, they necessarily get all of the overlapping SS.

This was explained in the answer to my question "https://stats.stackexchange.com/questions/323572/in-regression-analysis-how-can-r2-represent-the-total-explained-variance-if-i" - an answer that I admit is still a bit too complicated for me to understand fully. But I did take away from this answer that the $\beta$ variance matrix is virtually never diagonal - which I take to mean that the regression coefficients aren't orthogonal, and therefore do 'get' overlapping SS, which explains their covariation.

So, assuming this understanding so far is correct, this leads me to wonder: how does the software decide which predictors 'gets' which parts of the overlapping SS?

Is the overlapping SS simply divided in half? Or does the predictor with the highest bivariate correlation get it all? Or does the software play 'Eeny, meeny, miny, moe'?

To ease the discussion, I've simulated some data. I created three variables: one criterion ('Y') and two predictors ('X1' and 'X2'). The two predictors are means of a number of indicators, four of which are a part of both variables to create clear overlap. This is the correlation matrix:

      Y   X1   X2
Y  1.00 0.42 0.51
X1 0.42 1.00 0.76
X2 0.51 0.76 1.00

This is a Venn Euler diagram of the variances and explained variances:

A Venn Euler diagram showing the variances and explained variances.

In a regression analysis, the regression coefficient of X1 is 0.07 and the regression coefficient of X2 is 0.46 (all variables are standardized). The regression coefficient of X2 is much larger, falsely implying that it's much more strongly associated to Y than X1 is (at least, this is the way most researchers in my field, health psychology, would interpret these regression coefficients).

So, the overlapping SS (the middle, 0.176, area) seems to get 'awarded' to X2 more than to X1; perhaps completely to X2. Why? How is this determined?

In regression analysis, predictors sometimes correlate (and in my field, psychology, they always do; often because they are simply measurements of the same aspects of human psychology).

If predictors correlate in their prediction of the criterion (the dependent variable), this means that the sums of squares (SS) of the criterion cannot be cleanly partitioned between predictors. There are different ways to decide how to deal with this 'overlapping' SS. Most software programs by default use Type II SS, which means that the overlapping SS is 'thrown away', as explained in question "https://stats.stackexchange.com/questions/24827/where-is-the-shared-variance-between-all-ivs-in-a-linear-multiple-regression-equ?noredirect=1&lq=1".

However. It's not really thrown away, is it?

Because all SS, including the overlapping region, is included in the proportion of explained variance ($R^2$) which is equal to:

$$R^2 = r_{y\hat{y}}^2$$

And:

$$\hat{y} = \beta_0 + \beta_1 x_1 + \beta_2 x_2$$

So necessarily the regression coefficients do somehow 'get' some of the overlapping SS - in fact, between them, they necessarily get all of the overlapping SS.

This was explained in the answer to my question "https://stats.stackexchange.com/questions/323572/in-regression-analysis-how-can-r2-represent-the-total-explained-variance-if-i" - an answer that I admit is still a bit too complicated for me to understand fully. But I did take away from this answer that the $\beta$ variance matrix is virtually never diagonal - which I take to mean that the regression coefficients aren't orthogonal, and therefore do 'get' overlapping SS, which explains their covariation.

So, assuming this understanding so far is correct, this leads me to wonder: how does the software decide which predictors 'gets' which parts of the overlapping SS?

Is the overlapping SS simply divided in half? Or does the predictor with the highest bivariate correlation get it all? Or does the software play 'Eeny, meeny, miny, moe'?

To ease the discussion, I've simulated some data. I created three variables: one criterion ('Y') and two predictors ('X1' and 'X2'). The two predictors are means of a number of indicators, four of which are a part of both variables to create clear overlap. This is the correlation matrix:

      Y   X1   X2
Y  1.00 0.42 0.51
X1 0.42 1.00 0.76
X2 0.51 0.76 1.00

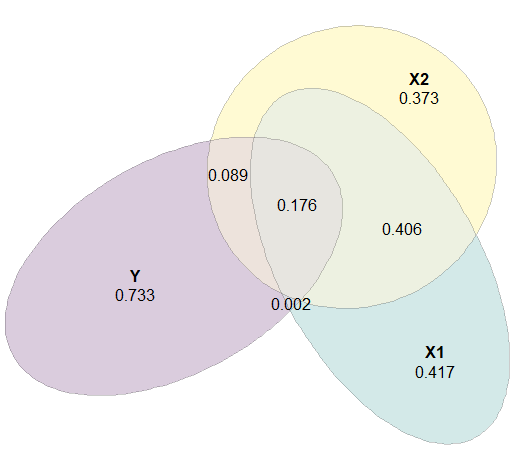
This is a Venn Euler diagram of the variances and explained variances:

A Venn Euler diagram showing the variances and explained variances.

In a regression analysis, the regression coefficient of X1 is 0.07 and the regression coefficient of X2 is 0.46 (all variables are standardized). The regression coefficient of X2 is much larger, falsely implying that it's much more strongly associated to Y than X1 is (at least, this is the way most researchers in my field, health psychology, would interpret these regression coefficients).

So, the overlapping SS (the middle, 0.176, area) seems to get 'awarded' to X2 more than to X1; perhaps completely to X2. Why? How is this determined?

In regression analysis, predictors sometimes correlate (and in my field, psychology, they always do; often because they are simply measurements of the same aspects of human psychology).

If predictors correlate in their prediction of the criterion (the dependent variable), this means that the sums of squares (SS) of the criterion cannot be cleanly partitioned between predictors. There are different ways to decide how to deal with this 'overlapping' SS. Most software programs by default use Type III SS, which means that the overlapping SS is 'thrown away', as explained in question "https://stats.stackexchange.com/questions/24827/where-is-the-shared-variance-between-all-ivs-in-a-linear-multiple-regression-equ?noredirect=1&lq=1".

However. It's not really thrown away, is it?

Because all SS, including the overlapping region, is included in the proportion of explained variance ($R^2$) which is equal to:

$$R^2 = r_{y\hat{y}}^2$$

And:

$$\hat{y} = \beta_0 + \beta_1 x_1 + \beta_2 x_2$$

So necessarily the regression coefficients do somehow 'get' some of the overlapping SS - in fact, between them, they necessarily get all of the overlapping SS.

This was explained in the answer to my question "https://stats.stackexchange.com/questions/323572/in-regression-analysis-how-can-r2-represent-the-total-explained-variance-if-i" - an answer that I admit is still a bit too complicated for me to understand fully. But I did take away from this answer that the $\beta$ variance matrix is virtually never diagonal - which I take to mean that the regression coefficients aren't orthogonal, and therefore do 'get' overlapping SS, which explains their covariation.

So, assuming this understanding so far is correct, this leads me to wonder: how does the software decide which predictors 'gets' which parts of the overlapping SS?

Is the overlapping SS simply divided in half? Or does the predictor with the highest bivariate correlation get it all? Or does the software play 'Eeny, meeny, miny, moe'?

To ease the discussion, I've simulated some data. I created three variables: one criterion ('Y') and two predictors ('X1' and 'X2'). The two predictors are means of a number of indicators, four of which are a part of both variables to create clear overlap. This is the correlation matrix:

      Y   X1   X2
Y  1.00 0.42 0.51
X1 0.42 1.00 0.76
X2 0.51 0.76 1.00

This is a Venn Euler diagram of the variances and explained variances:

A Venn Euler diagram showing the variances and explained variances.

In a regression analysis, the regression coefficient of X1 is 0.07 and the regression coefficient of X2 is 0.46 (all variables are standardized). The regression coefficient of X2 is much larger, falsely implying that it's much more strongly associated to Y than X1 is (at least, this is the way most researchers in my field, health psychology, would interpret these regression coefficients).

So, the overlapping SS (the middle, 0.176, area) seems to get 'awarded' to X2 more than to X1; perhaps completely to X2. Why? How is this determined?

Source Link
Matherion
  • 487
  • 5
  • 13

In regression, when partitioning SS among predictors, what determines which predictors get the SS that can be attributed to more than one predictor?

In regression analysis, predictors sometimes correlate (and in my field, psychology, they always do; often because they are simply measurements of the same aspects of human psychology).

If predictors correlate in their prediction of the criterion (the dependent variable), this means that the sums of squares (SS) of the criterion cannot be cleanly partitioned between predictors. There are different ways to decide how to deal with this 'overlapping' SS. Most software programs by default use Type II SS, which means that the overlapping SS is 'thrown away', as explained in question "https://stats.stackexchange.com/questions/24827/where-is-the-shared-variance-between-all-ivs-in-a-linear-multiple-regression-equ?noredirect=1&lq=1".

However. It's not really thrown away, is it?

Because all SS, including the overlapping region, is included in the proportion of explained variance ($R^2$) which is equal to:

$$R^2 = r_{y\hat{y}}^2$$

And:

$$\hat{y} = \beta_0 + \beta_1 x_1 + \beta_2 x_2$$

So necessarily the regression coefficients do somehow 'get' some of the overlapping SS - in fact, between them, they necessarily get all of the overlapping SS.

This was explained in the answer to my question "https://stats.stackexchange.com/questions/323572/in-regression-analysis-how-can-r2-represent-the-total-explained-variance-if-i" - an answer that I admit is still a bit too complicated for me to understand fully. But I did take away from this answer that the $\beta$ variance matrix is virtually never diagonal - which I take to mean that the regression coefficients aren't orthogonal, and therefore do 'get' overlapping SS, which explains their covariation.

So, assuming this understanding so far is correct, this leads me to wonder: how does the software decide which predictors 'gets' which parts of the overlapping SS?

Is the overlapping SS simply divided in half? Or does the predictor with the highest bivariate correlation get it all? Or does the software play 'Eeny, meeny, miny, moe'?

To ease the discussion, I've simulated some data. I created three variables: one criterion ('Y') and two predictors ('X1' and 'X2'). The two predictors are means of a number of indicators, four of which are a part of both variables to create clear overlap. This is the correlation matrix:

      Y   X1   X2
Y  1.00 0.42 0.51
X1 0.42 1.00 0.76
X2 0.51 0.76 1.00

This is a Venn Euler diagram of the variances and explained variances:

A Venn Euler diagram showing the variances and explained variances.

In a regression analysis, the regression coefficient of X1 is 0.07 and the regression coefficient of X2 is 0.46 (all variables are standardized). The regression coefficient of X2 is much larger, falsely implying that it's much more strongly associated to Y than X1 is (at least, this is the way most researchers in my field, health psychology, would interpret these regression coefficients).

So, the overlapping SS (the middle, 0.176, area) seems to get 'awarded' to X2 more than to X1; perhaps completely to X2. Why? How is this determined?