deleted 3 characters in body
Source Link
Nick Cox
  • 59.5k
  • 8
  • 136
  • 212

Tha accepted answer from @Anthony makes the main point: your resultsdata have tickled a bug in the software you used.

How best to treat such data depends on knowing more about how it wasthey were produced and your goals.

Tha accepted answer from @Anthony makes the main point: your results have tickled a bug in the software you used.

How best to treat such data depends on knowing more about how it was produced and your goals.

Tha accepted answer from @Anthony makes the main point: your data have tickled a bug in the software you used.

How best to treat such data depends on knowing more about how they were produced and your goals.

added 164 characters in body
Source Link
Nick Cox
  • 59.5k
  • 8
  • 136
  • 212

As in the distribution histogram shown in the question for other data, you have a spiky, roughly U-shaped distribution. A logarithmic transformation will not help with such a distribution. It will just make it look and be a worse fit to a normal. The spikes will remain spikes. Here is a graph of the distribution.

That aside, for these data I get the following results for moment-based statistics in Stata. The definitions used (on which a Gaussian/normal would have skewness 0 and kurtosis 3) are documented on p.9 of stata.com/manuals/rsummarize this section in the Stata manuals.pdf 

Other formulas exist but for this sample size they shouldn't make that much difference.

In terms of kurtosis the example data here are clearly non-normal. Any test based on skewness and kurtosis should therefore reject a null of normality. For context, minimum possible kurtosis is 1 (excess kurtosis $−$2); that minimum is attainable if half the data are equal to a maximum and half equal to a minimum (e.g. probability of 0 and of 1 both 0.5). Kurtosis just above 1 is expected for a U-shaped distribution, as here.

How best to treat such data depends on knowing more about how it was produced and your goals.

As in the distribution histogram shown in the question for other data, you have a spiky, roughly U-shaped distribution. A logarithmic transformation will not help with such a distribution. It will just make it look and be a worse fit. The spikes will remain spikes. Here is a graph of the distribution.
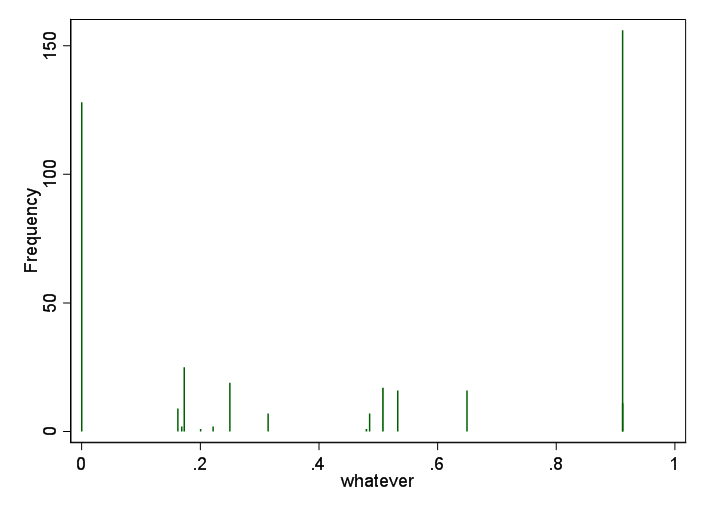
That aside, for these data I get the following results for moment-based statistics in Stata. The definitions used (on which a Gaussian/normal would have skewness 0 and kurtosis 3) are documented on p.9 of stata.com/manuals/rsummarize.pdf Other formulas exist but for this sample size they shouldn't make that much difference.

In terms of kurtosis the example data here are clearly non-normal. Any test based on skewness and kurtosis should therefore reject a null of normality. For context, minimum possible kurtosis is 1 (excess kurtosis $−$2); that minimum is attainable if half the data are equal to a maximum and half equal to a minimum (e.g. probability of 0 and of 1 both 0.5). Kurtosis just above 1 is expected for a U-shaped distribution, as here.

As in the distribution histogram shown in the question for other data, you have a spiky, roughly U-shaped distribution. A logarithmic transformation will not help with such a distribution. It will just make it look and be a worse fit to a normal. The spikes will remain spikes. Here is a graph of the distribution.

That aside, for these data I get the following results for moment-based statistics in Stata. The definitions used (on which a Gaussian/normal would have skewness 0 and kurtosis 3) are documented on p.9 of this section in the Stata manuals. 

Other formulas exist but for this sample size they shouldn't make that much difference.

In terms of kurtosis the example data here are clearly non-normal. Any test based on skewness and kurtosis should therefore reject a null of normality. For context, minimum possible kurtosis is 1 (excess kurtosis $−$2); that minimum is attainable if half the data are equal to a maximum and half equal to a minimum (e.g. probability of 0 and of 1 both 0.5). Kurtosis just above 1 is expected for a U-shaped distribution, as here.

How best to treat such data depends on knowing more about how it was produced and your goals.

Source Link
Nick Cox
  • 59.5k
  • 8
  • 136
  • 212

Tha accepted answer from @Anthony makes the main point: your results have tickled a bug in the software you used.

This is a bundle of extra comments using the sample given in Edit II as a sandbox.

As in the distribution histogram shown in the question for other data, you have a spiky, roughly U-shaped distribution. A logarithmic transformation will not help with such a distribution. It will just make it look and be a worse fit. The spikes will remain spikes. Here is a graph of the distribution.

enter image description here

There should be a story behind the repeated values: in a sample of 417, you have only a small number of distinct values.

   whatever |      Freq.     Percent        Cum.
------------+-----------------------------------
      .0001 |        128       30.70       30.70
      .1622 |          9        2.16       32.85
      .1687 |          2        0.48       33.33
      .1729 |         25        6.00       39.33
      .2005 |          1        0.24       39.57
      .2216 |          2        0.48       40.05
      .2498 |         19        4.56       44.60
      .3143 |          7        1.68       46.28
        .48 |          1        0.24       46.52
      .4854 |          7        1.68       48.20
      .5078 |         17        4.08       52.28
      .5328 |         16        3.84       56.12
      .6496 |         16        3.84       59.95
      .9119 |        156       37.41       97.36
       .912 |         11        2.64      100.00
------------+-----------------------------------
      Total |        417      100.00

That aside, for these data I get the following results for moment-based statistics in Stata. The definitions used (on which a Gaussian/normal would have skewness 0 and kurtosis 3) are documented on p.9 of stata.com/manuals/rsummarize.pdf Other formulas exist but for this sample size they shouldn't make that much difference.

 ----------------------------------------------------------
  n = 417 |       mean          SD    skewness    kurtosis
----------+-----------------------------------------------
 whatever |      0.473       0.398      -0.027       1.243
----------------------------------------------------------

Some people like to work with so-called excess kurtosis, subtracting 3. Here that would be $−$1.757.

In terms of kurtosis the example data here are clearly non-normal. Any test based on skewness and kurtosis should therefore reject a null of normality. For context, minimum possible kurtosis is 1 (excess kurtosis $−$2); that minimum is attainable if half the data are equal to a maximum and half equal to a minimum (e.g. probability of 0 and of 1 both 0.5). Kurtosis just above 1 is expected for a U-shaped distribution, as here.