added 1306 characters in body
Source Link

For the specified problem, a ROC curve (receiver operator characteristic) could be used to measuremeasuring the Area Under the Curve of a Receiver Operator Characteristic curve might help. Then you

I am not an expert in this so I try to keep it simple. Please comment on any error or wrong interpretation so I can compare the AUC values between different variableschange it.

$x$ is your continuous variable. $y$ is your categorical. See how many True Positives and False Positives do you get if you choose a value of $x$ as being the threshold between positives and negatives (or male and female) and you compare this to the real labels. For e.g. you choose 7, then above $x$=7 are all female (1) and below $x$=7 all male (0). Compare this to the real labels and get the number of true positives and false positives of your prediction.

Repeating the procedure explained above, from min($x$) to max($x$) you will generate the true positive and the false positive rates and then you can plot them like in the figure below and you can calculate the Area Under the Curve.

The idea is that if there is no correlation between the variables, you will get the same rateratio of true positives and true negatives for all values of $x$, nevertheless, if there is good correlation (and the oppositesame stands for anti-correlation) you will get morethe ratio of true positives thanto true negatives for most values ofwill strongly vary as $x$ varies.

The above statement is calulcated with the Area Under the Curve.
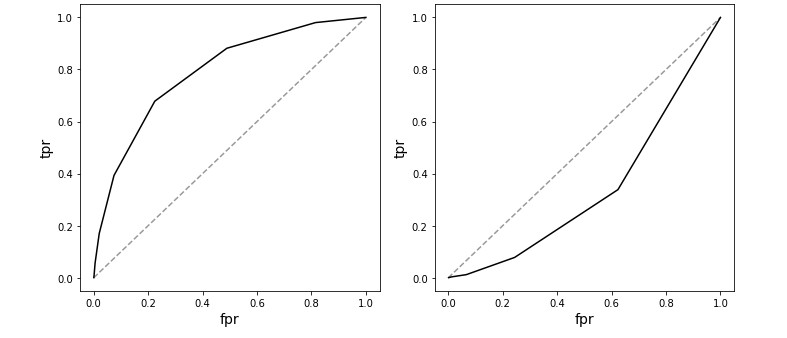
Example of good correlation (right) and fair anti-correlation (left) Example of good correlation (right) and fair anti-correlation (left).

For the specified problem, a ROC curve (receiver operator characteristic) could be used to measure the Area Under the Curve. Then you can compare the AUC values between different variables.

$x$ is your continuous variable. $y$ is your categorical. See how many True Positives and False Positives do you get if you choose a value of $x$ as being the threshold between positives and negatives (or male and female) and you compare this to the real labels. For e.g. you choose 7, then above $x$=7 are all female (1) and below $x$=7 all male (0). Compare this to the real labels and get the number of true positives and false positives of your prediction.

Repeating the procedure explained above, from min($x$) to max($x$) you will generate the true positive and the false positive rates and then you can plot them like in the figure below and you can calculate the Area Under the Curve.

The idea is that if there is no correlation between the variables, you will get the same rate of true positives and true negatives for all values of $x$, nevertheless, if there is good correlation (and the opposite stands for anti-correlation) you will get more true positives than true negatives for most values of $x$.

The above statement is calulcated with the Area Under the Curve.

Example of good correlation (right) and fair anti-correlation (left) Example of good correlation (right) and fair anti-correlation (left)

For the specified problem, measuring the Area Under the Curve of a Receiver Operator Characteristic curve might help.

I am not an expert in this so I try to keep it simple. Please comment on any error or wrong interpretation so I can change it.

$x$ is your continuous variable. $y$ is your categorical. See how many True Positives and False Positives do you get if you choose a value of $x$ as being the threshold between positives and negatives (or male and female) and you compare this to the real labels. For e.g. you choose 7, then above $x$=7 are all female (1) and below $x$=7 all male (0). Compare this to the real labels and get the number of true positives and false positives of your prediction.

Repeating the procedure explained above, from min($x$) to max($x$) you will generate the true positive and the false positive rates and then you can plot them like in the figure below and you can calculate the Area Under the Curve.

The idea is that if there is no correlation between the variables, you will get the same ratio of true positives and true negatives for all values of $x$, nevertheless, if there is good correlation (and the same stands for anti-correlation) the ratio of true positives to true negatives will strongly vary as $x$ varies.

The above statement is calulcated with the Area Under the Curve.

Example of good correlation (right) and fair anti-correlation (left) Example of good correlation (right) and fair anti-correlation (left).

added 1306 characters in body
Source Link

For the specified problem, a ROC curve (receiver operator characteristic) could be used to measure the Area Under the Curve. Then you can compare the AUC values between different variables.

$x$ is your continuous variable. $y$ is your categorical. See how many True Positives and False Positives do you get if you choose a value of $x$ as being the threshold between positives and negatives (or male and female) and you compare this to the real labels. For e.g. you choose 7, then above $x$=7 are all female (1) and below $x$=7 all male (0). Compare this to the real labels and get the number of true positives and false positives of your prediction.

Repeating the procedure explained above, from min($x$) to max($x$) you will generate the true positive and the false positive rates and then you can plot them like in the figure below and you can calculate the Area Under the Curve.

The idea is that if there is no correlation between the variables, you will get the same rate of true positives and true negatives for all values of $x$, nevertheless, if there is good correlation (and the opposite stands for anti-correlation) you will get more true positives than true negatives for most values of $x$.

The above statement is calulcated with the Area Under the Curve.

Example of good correlation (right) and fair anti-correlation (left) Example of good correlation (right) and fair anti-correlation (left)

For the specified problem, a ROC curve (receiver operator characteristic) could be used to measure the Area Under the Curve. Then you can compare the AUC values between different variables.

For the specified problem, a ROC curve (receiver operator characteristic) could be used to measure the Area Under the Curve. Then you can compare the AUC values between different variables.

$x$ is your continuous variable. $y$ is your categorical. See how many True Positives and False Positives do you get if you choose a value of $x$ as being the threshold between positives and negatives (or male and female) and you compare this to the real labels. For e.g. you choose 7, then above $x$=7 are all female (1) and below $x$=7 all male (0). Compare this to the real labels and get the number of true positives and false positives of your prediction.

Repeating the procedure explained above, from min($x$) to max($x$) you will generate the true positive and the false positive rates and then you can plot them like in the figure below and you can calculate the Area Under the Curve.

The idea is that if there is no correlation between the variables, you will get the same rate of true positives and true negatives for all values of $x$, nevertheless, if there is good correlation (and the opposite stands for anti-correlation) you will get more true positives than true negatives for most values of $x$.

The above statement is calulcated with the Area Under the Curve.

Example of good correlation (right) and fair anti-correlation (left) Example of good correlation (right) and fair anti-correlation (left)

Source Link

For the specified problem, a ROC curve (receiver operator characteristic) could be used to measure the Area Under the Curve. Then you can compare the AUC values between different variables.