###Definitely not.
I agree that t-SNE is an amazing algorithm that works extremely well and that was a real breakthrough at the time. However:
- it does have serious shortcomings;
- some of the shortcomings must be solvable;
- there already are algorithms that perform much better in some cases;
- many t-SNE's properties are still poorly understood.
Somebody linked to this very popular account of some shortcomings of t-SNE: https://distill.pub/2016/misread-tsne/ (+1), but it only discusses very simple toy datasets and I find that it does not correspond very well to the problems that one faces in practice when working with t-SNE and related algorithms on real-world data. For example:
- t-SNE often fails to preserve global structure of the dataset;
- t-SNE tends to suffer from "overcrowding" when $N$ grows above ~100k;
- Barnes-Hut runtime is too slow for large $N$.
I will briefly discuss all three below.
- t-SNE often fails to preserve global structure of the dataset.
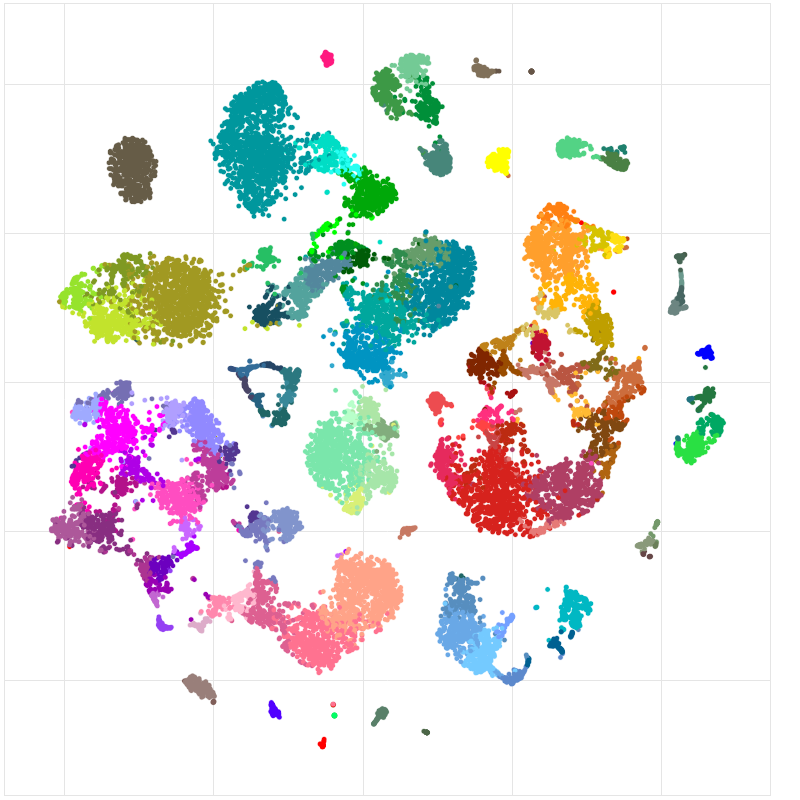
Consider this single cell RNA-seq dataset from the Allen institute (mouse cortical cells): http://celltypes.brain-map.org/rnaseq/mouse. It has ~23k cells. We know a priori that this dataset has a lot of meaningful hierarchical structure, and this is confirmed by hierarchical clustering. There are neurons and non-neural cells (glia, astrocytes, etc.). Among neurons, there are excitatory and inhibitory neurons -- two very different groups. Among e.g. inhibitory neurons, there are several major groups: Pvalb-expressing, SSt-expressing, VIP-expressing. In any of these groups, there seem to be multiple further clusters. This is reflected in the hierarchical clustering tree. But here is t-SNE, taken from the link above:

Non-neural cells are in grey/brown/black. Excitatory neurons are in blue/teal/green. Inhibitory neurons are in orange/red/purple. One would want these major groups to stick together, but this does not happen: once t-SNE separates a group into several clusters, they can end up being positioned arbitrarily. The hierarchical structure of the dataset is lost.
I think this should be a solvable problem, but I am not aware of any good principled developments, despite some recent work in this direction.
- t-SNE tends to suffer from "overcrowding" when $N$ grows above ~100k
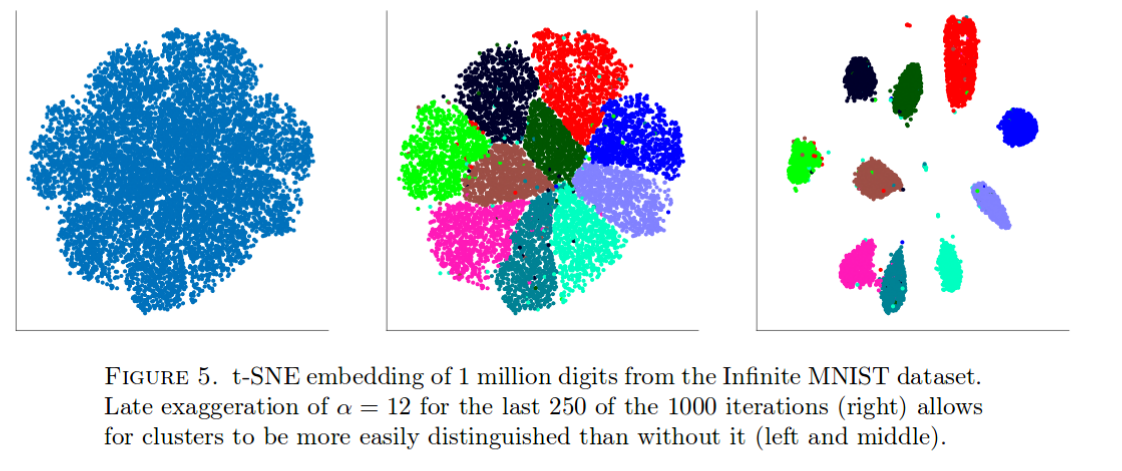
t-SNE works very well on the MNIST data. But consider this (taken from this paper):

With 1 mln data points, all clusters get clumped together (the exact reason for this is not very clear) and the only known way to counter-balance is with some dirty hacks as shown above. I know from experience that this happens with other similarly large datasets as well.
One can arguably see this with MNIST itself (N=70k). Take a look:

On the right is t-SNE. On the left is UMAP, a new exciting method under active development, that is very similar to an older largeVis. UMAP/largeVis pull clusters much further apart.
- Barnes-Hut runtime is too slow for large $N$
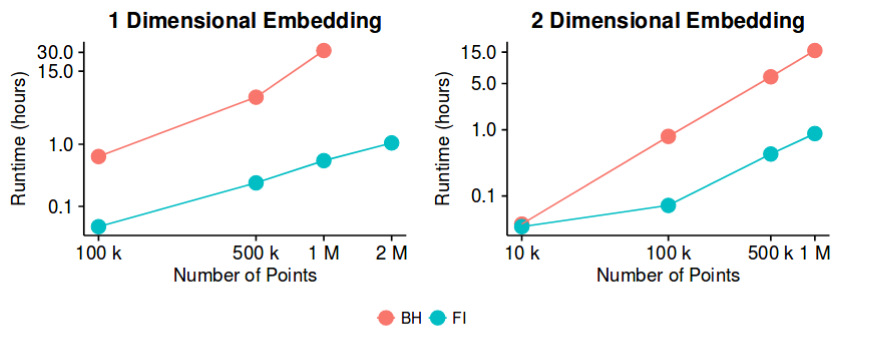
Vanilla t-SNE is unusable for $N$ over ~10k. The standard solution until recently was Barnes-Hut t-SNE, however for $N$ closer to ~1mln it becomes painfully slow. This is one of the big selling points of UMAP, but actually a recent paper suggested FFT-accelerated t-SNE (FIt-SNE) that works much faster than Barnes-Hut t-SNE and is at least as fast as UMAP. I recommend everybody to use this implementation from now on.

So this might not exactly be an open problem anymore, but it used to be until very recently, and I guess there is room for further improvements in runtime. So work can certainly continue in this direction.


