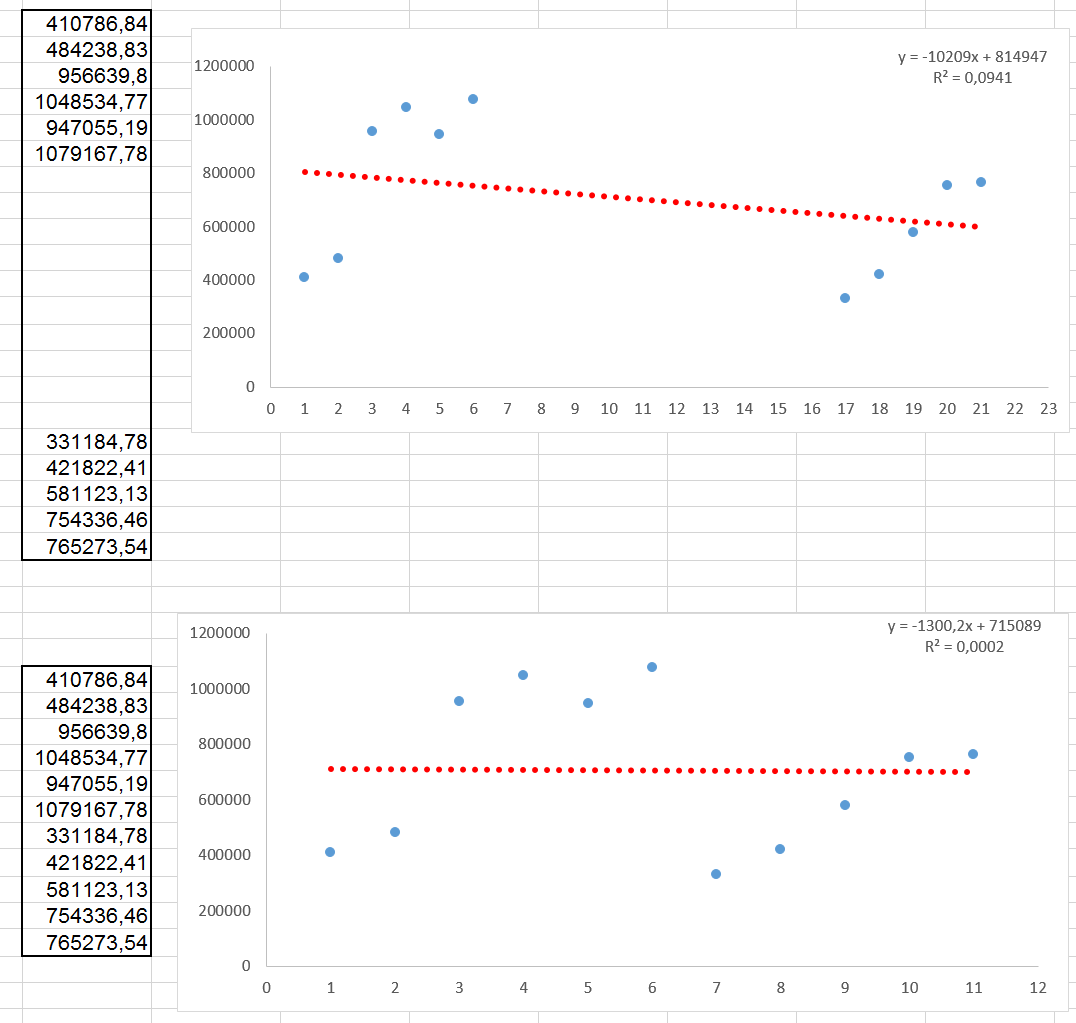
I have a scatter plot in Excel (upper part of the screenshot) of time-series data. In-between the values that I plot (to the left), are some missings. I fit a (linear) line to those values and display the according model. I realized that Excel doesn't just leave out the missing values. Leaving those out would lead to the model in the bottom. As you can tell by comparing the model equation (and also the fitted line) it is very different.
Now, I wonder what Excel does to account for the missing values so to still be able to fit the line. There must be some kind of interpolation going on. But which method is used? There are no options to chose from and I can't seem to find it documented anywhere.
Also, does the method change when I change the fitting to "logarithmic"?
/e: @user12075: Thanks! You are completely right. Now, I'm wondering if this behavior makes sense? For me at least it was confusing.
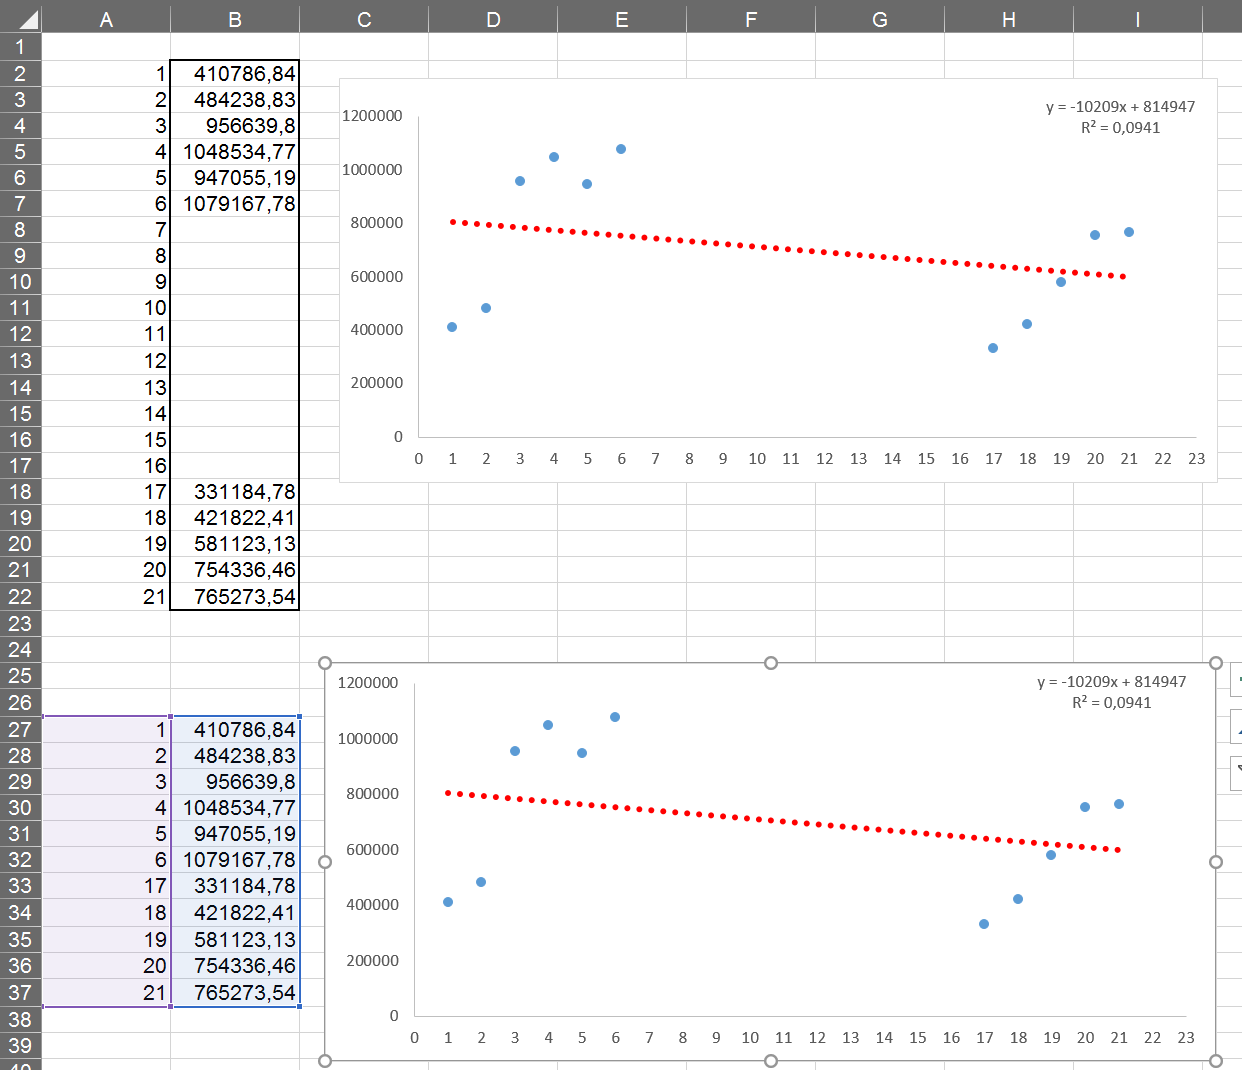
Here's the proof to your answer:


