added 1116 characters in body
Source Link
Carl
  • 13.3k
  • 7
  • 55
  • 115

Plot of output aswas shown above.

The answer here echos the results of a recent paper by Yafune et al. A Note on Sample Size Determination for Akaike Information Criterion (AIC) Approach to Clinical Data Analysis, which unfortunately is behind a paywall. Those authors state in their discussion that "AIC is generally used without paying attention to the probabilities corresponding to the power of statistical tests. Since AIC is usually used for exploratory analysis, it is often difficult to determine the sample sizes in advance. For such cases, it is desirable to investigate afterwards whether the sample sizes are large enough by checking the probabilities corresponding to the power of statistical tests. If the sample sizes are not large enough, it is possible that the AIC approach does not lead us to the conclusions which we seek."

To this we would only add that the sample sizes indicated in that paper can easily exceed 100 for a power of 0.8.

Plot output as above.

Plot of output was shown above.

The answer here echos the results of a recent paper by Yafune et al. A Note on Sample Size Determination for Akaike Information Criterion (AIC) Approach to Clinical Data Analysis, which unfortunately is behind a paywall. Those authors state in their discussion that "AIC is generally used without paying attention to the probabilities corresponding to the power of statistical tests. Since AIC is usually used for exploratory analysis, it is often difficult to determine the sample sizes in advance. For such cases, it is desirable to investigate afterwards whether the sample sizes are large enough by checking the probabilities corresponding to the power of statistical tests. If the sample sizes are not large enough, it is possible that the AIC approach does not lead us to the conclusions which we seek."

To this we would only add that the sample sizes indicated in that paper can easily exceed 100 for a power of 0.8.

Contains fit program.
Source Link
Carl
  • 13.3k
  • 7
  • 55
  • 115

I would really rather someone else answer this questionAbout the program: lists are initialized as normal distribution (nd) AIC (ndAlist), nd BIC (ndBlist), uniform distribution (ud) AIC and will happily award the bountyBIC (udAlist, udBlist). Two do loops are used. The outer do loop increments $n$ from 5 to anyone who can take me out100 in increments of $n=5$. The inner do loop (1) creates $n$ random variates (named dat) from an $\mathcal{N}(0,1)$. Then (2) creates an emperical CDF named edistdata from dat. (3) Defines cdfn and cdfu functions for fitting from the echo chamberCDFs of my talkingnd and ud. (4) Best fits by variation of parameters of cdfn and cdfu to myselfedistdata. Note: Fitting to CDFs rather than PDFs markedly decreases noise and is a common procedure. This is done, rather than, for example, using mean and variance to calculate nd or min and max to calculate ud because the fitting uses a single algorithm for both nd and ud and that NonlinearModelFit routine outputs AIC and BIC for the models as well as parameters as options for the output nlmn and nlmu fit outputs, e.g., as nlmn["AIC"]. Note: it is assumed that the AIC and BIC fit parameters are correctly calculated using ML as the contrary case would be meaningless.

(*Mathematica Program*)
ndAlist = {};
ndBlist = {};
udAlist = {};
udBlist = {};
Do[
 AICndlist = {};
 BICndlist = {};
 AICudlist = {};
 BICudlist = {};
  Do[dat = 
   RandomVariate[NormalDistribution[0, 1], n, WorkingPrecision -> 40];
   edistdata = Table[{x, CDF[EmpiricalDistribution[dat], x]}, {x, dat}];
   cdfn[a1_, a2_, x_] := CDF[NormalDistribution[a1, a2], x];
   cdfu[b1_, b2_, x_] := CDF[UniformDistribution[{b1, b2}], x];
   nlmn = NonlinearModelFit[edistdata, cdfn[a1, a2, x], {{a1, 0}, {a2, 1}}, x];
   nlmu = NonlinearModelFit[edistdata, cdfu[b1, b2, x], {{b1, -2}, {b2, 2}}, x]; 
   AICndlist = AppendTo[AICndlist, nlmn["AIC"]]; 
   BICndlist = AppendTo[BICndlist, nlmn["BIC"]]; 
   AICudlist = AppendTo[AICudlist, nlmu["AIC"]]; 
   BICudlist = AppendTo[BICudlist, nlmu["BIC"]],
  {i, 1, 1000}];
 ndA = 0.; udA = 0.; ndB = 0.; udB = 0.;
 Do[If[AICndlist[[j]] < AICudlist[[j]], ndA = ndA + 1, udA = udA + 1], 
 {j, 1, 1000}];
 Do[If[BICndlist[[j]] < BICudlist[[j]], ndB = ndB + 1, udB = udB + 1], 
 {j, 1, 1000}];
Print["n: ", n, "\nAIC nd/1000: ", ndA, "\tAIC ud/1000: ", udA, "\nBIC nd/1000: ", ndB, "\tBIC ud/1000: ", udB];
ndAlist = AppendTo[ndAlist, {n, ndB}]; 
ndBlist = AppendTo[ndBlist, {n, ndB}], {n, 5, 100, 5}]
Print[ndAlist]
ListPlot[ndAlist, AxesLabel -> {"n", "AIC ND < AIC UD"}, PlotRange -> {{0, 100}, {0, 1000}}, PlotRangePadding -> {{0, 1}, {0, 0}}]

(Numerical Output)

n: 5
AIC nd/1000: 395.   AIC ud/1000: 605.
BIC nd/1000: 395.   BIC ud/1000: 605.

n: 10
AIC nd/1000: 572.   AIC ud/1000: 428.
BIC nd/1000: 572.   BIC ud/1000: 428.

n: 15
AIC nd/1000: 684.   AIC ud/1000: 316.
BIC nd/1000: 684.   BIC ud/1000: 316.

n: 20
AIC nd/1000: 725.   AIC ud/1000: 275.
BIC nd/1000: 725.   BIC ud/1000: 275.

n: 25
AIC nd/1000: 769.   AIC ud/1000: 231.
BIC nd/1000: 769.   BIC ud/1000: 231.

n: 30
AIC nd/1000: 777.   AIC ud/1000: 223.
BIC nd/1000: 777.   BIC ud/1000: 223.

n: 35
AIC nd/1000: 811.   AIC ud/1000: 189.
BIC nd/1000: 811.   BIC ud/1000: 189.

n: 40
AIC nd/1000: 841.   AIC ud/1000: 159.
BIC nd/1000: 841.   BIC ud/1000: 159.

n: 45
AIC nd/1000: 848.   AIC ud/1000: 152.
BIC nd/1000: 848.   BIC ud/1000: 152.

n: 50
AIC nd/1000: 848.   AIC ud/1000: 152.
BIC nd/1000: 848.   BIC ud/1000: 152.

n: 55
AIC nd/1000: 877.   AIC ud/1000: 123.
BIC nd/1000: 877.   BIC ud/1000: 123.

n: 60
AIC nd/1000: 886.   AIC ud/1000: 114.
BIC nd/1000: 886.   BIC ud/1000: 114.

n: 65
AIC nd/1000: 900.   AIC ud/1000: 100.
BIC nd/1000: 900.   BIC ud/1000: 100.

n: 70
AIC nd/1000: 901.   AIC ud/1000: 99.
BIC nd/1000: 901.   BIC ud/1000: 99.

n: 75
AIC nd/1000: 914.   AIC ud/1000: 86.
BIC nd/1000: 914.   BIC ud/1000: 86.

n: 80
AIC nd/1000: 932.   AIC ud/1000: 68.
BIC nd/1000: 932.   BIC ud/1000: 68.

n: 85
AIC nd/1000: 935.   AIC ud/1000: 65.
BIC nd/1000: 935.   BIC ud/1000: 65.

n: 90
AIC nd/1000: 946.   AIC ud/1000: 54.
BIC nd/1000: 946.   BIC ud/1000: 54.

n: 95
AIC nd/1000: 952.   AIC ud/1000: 48.
BIC nd/1000: 952.   BIC ud/1000: 48.

n: 100
AIC nd/1000: 949.   AIC ud/1000: 51.
BIC nd/1000: 949.   BIC ud/1000: 51.

{{5,395.},{10,572.},{15,684.},{20,725.},{25,769.},{30,777.},{35,811.},{40,841.},{45,848.},{50,848.},{55,877.},{60,886.},{65,900.},{70,901.},{75,914.},{80,932.},{85,935.},{90,946.},{95,952.},{100,949.}}

Plot output as above.

I would really rather someone else answer this question, and will happily award the bounty to anyone who can take me out of the echo chamber of my talking to myself.

About the program: lists are initialized as normal distribution (nd) AIC (ndAlist), nd BIC (ndBlist), uniform distribution (ud) AIC and BIC (udAlist, udBlist). Two do loops are used. The outer do loop increments $n$ from 5 to 100 in increments of $n=5$. The inner do loop (1) creates $n$ random variates (named dat) from an $\mathcal{N}(0,1)$. Then (2) creates an emperical CDF named edistdata from dat. (3) Defines cdfn and cdfu functions for fitting from the CDFs of nd and ud. (4) Best fits by variation of parameters of cdfn and cdfu to edistdata. Note: Fitting to CDFs rather than PDFs markedly decreases noise and is a common procedure. This is done, rather than, for example, using mean and variance to calculate nd or min and max to calculate ud because the fitting uses a single algorithm for both nd and ud and that NonlinearModelFit routine outputs AIC and BIC for the models as well as parameters as options for the output nlmn and nlmu fit outputs, e.g., as nlmn["AIC"]. Note: it is assumed that the AIC and BIC fit parameters are correctly calculated using ML as the contrary case would be meaningless.

(*Mathematica Program*)
ndAlist = {};
ndBlist = {};
udAlist = {};
udBlist = {};
Do[
 AICndlist = {};
 BICndlist = {};
 AICudlist = {};
 BICudlist = {};
  Do[dat = 
   RandomVariate[NormalDistribution[0, 1], n, WorkingPrecision -> 40];
   edistdata = Table[{x, CDF[EmpiricalDistribution[dat], x]}, {x, dat}];
   cdfn[a1_, a2_, x_] := CDF[NormalDistribution[a1, a2], x];
   cdfu[b1_, b2_, x_] := CDF[UniformDistribution[{b1, b2}], x];
   nlmn = NonlinearModelFit[edistdata, cdfn[a1, a2, x], {{a1, 0}, {a2, 1}}, x];
   nlmu = NonlinearModelFit[edistdata, cdfu[b1, b2, x], {{b1, -2}, {b2, 2}}, x]; 
   AICndlist = AppendTo[AICndlist, nlmn["AIC"]]; 
   BICndlist = AppendTo[BICndlist, nlmn["BIC"]]; 
   AICudlist = AppendTo[AICudlist, nlmu["AIC"]]; 
   BICudlist = AppendTo[BICudlist, nlmu["BIC"]],
  {i, 1, 1000}];
 ndA = 0.; udA = 0.; ndB = 0.; udB = 0.;
 Do[If[AICndlist[[j]] < AICudlist[[j]], ndA = ndA + 1, udA = udA + 1], 
 {j, 1, 1000}];
 Do[If[BICndlist[[j]] < BICudlist[[j]], ndB = ndB + 1, udB = udB + 1], 
 {j, 1, 1000}];
Print["n: ", n, "\nAIC nd/1000: ", ndA, "\tAIC ud/1000: ", udA, "\nBIC nd/1000: ", ndB, "\tBIC ud/1000: ", udB];
ndAlist = AppendTo[ndAlist, {n, ndB}]; 
ndBlist = AppendTo[ndBlist, {n, ndB}], {n, 5, 100, 5}]
Print[ndAlist]
ListPlot[ndAlist, AxesLabel -> {"n", "AIC ND < AIC UD"}, PlotRange -> {{0, 100}, {0, 1000}}, PlotRangePadding -> {{0, 1}, {0, 0}}]

(Numerical Output)

n: 5
AIC nd/1000: 395.   AIC ud/1000: 605.
BIC nd/1000: 395.   BIC ud/1000: 605.

n: 10
AIC nd/1000: 572.   AIC ud/1000: 428.
BIC nd/1000: 572.   BIC ud/1000: 428.

n: 15
AIC nd/1000: 684.   AIC ud/1000: 316.
BIC nd/1000: 684.   BIC ud/1000: 316.

n: 20
AIC nd/1000: 725.   AIC ud/1000: 275.
BIC nd/1000: 725.   BIC ud/1000: 275.

n: 25
AIC nd/1000: 769.   AIC ud/1000: 231.
BIC nd/1000: 769.   BIC ud/1000: 231.

n: 30
AIC nd/1000: 777.   AIC ud/1000: 223.
BIC nd/1000: 777.   BIC ud/1000: 223.

n: 35
AIC nd/1000: 811.   AIC ud/1000: 189.
BIC nd/1000: 811.   BIC ud/1000: 189.

n: 40
AIC nd/1000: 841.   AIC ud/1000: 159.
BIC nd/1000: 841.   BIC ud/1000: 159.

n: 45
AIC nd/1000: 848.   AIC ud/1000: 152.
BIC nd/1000: 848.   BIC ud/1000: 152.

n: 50
AIC nd/1000: 848.   AIC ud/1000: 152.
BIC nd/1000: 848.   BIC ud/1000: 152.

n: 55
AIC nd/1000: 877.   AIC ud/1000: 123.
BIC nd/1000: 877.   BIC ud/1000: 123.

n: 60
AIC nd/1000: 886.   AIC ud/1000: 114.
BIC nd/1000: 886.   BIC ud/1000: 114.

n: 65
AIC nd/1000: 900.   AIC ud/1000: 100.
BIC nd/1000: 900.   BIC ud/1000: 100.

n: 70
AIC nd/1000: 901.   AIC ud/1000: 99.
BIC nd/1000: 901.   BIC ud/1000: 99.

n: 75
AIC nd/1000: 914.   AIC ud/1000: 86.
BIC nd/1000: 914.   BIC ud/1000: 86.

n: 80
AIC nd/1000: 932.   AIC ud/1000: 68.
BIC nd/1000: 932.   BIC ud/1000: 68.

n: 85
AIC nd/1000: 935.   AIC ud/1000: 65.
BIC nd/1000: 935.   BIC ud/1000: 65.

n: 90
AIC nd/1000: 946.   AIC ud/1000: 54.
BIC nd/1000: 946.   BIC ud/1000: 54.

n: 95
AIC nd/1000: 952.   AIC ud/1000: 48.
BIC nd/1000: 952.   BIC ud/1000: 48.

n: 100
AIC nd/1000: 949.   AIC ud/1000: 51.
BIC nd/1000: 949.   BIC ud/1000: 51.

{{5,395.},{10,572.},{15,684.},{20,725.},{25,769.},{30,777.},{35,811.},{40,841.},{45,848.},{50,848.},{55,877.},{60,886.},{65,900.},{70,901.},{75,914.},{80,932.},{85,935.},{90,946.},{95,952.},{100,949.}}

Plot output as above.
added 1311 characters in body
Source Link
Carl
  • 13.3k
  • 7
  • 55
  • 115

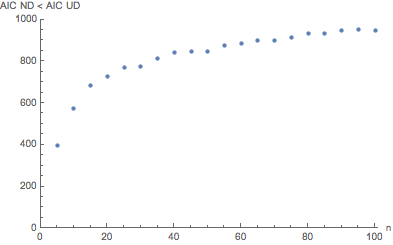
Suppose one generates values from a standard normal distribution, $\mathcal{N}(0,1)$. If we have only generated two values, $n=2$, then we have a discrete uniform distribution, not a convincingly discrete approximation of a normal distribution. Indeed, this is true for any $n=2$, no matter which generating distribution gave rise to those values, a discrete uniform distribution is a default result. Normal and uniform distributions are non-nested with respected to each other. Indeed, they have very different shapes. If we generate $\mathcal{N}(0,1)$ for increasing $n$ and examine AIC for fitting with a normal distribution versus a uniform distribution, even though we know that our generating function is $\mathcal{N}(0,1)$, AIC will not always be lesser for a normal distribution fit than for a uniform distribution fit. The plot below shows how many times out of 1000 repetitions AIC for a normal distribution model was better (less than) AIC for a uniform distribution model for $n$ varying from $n=5$ to $n=100$.

enter image description here

As can be seen in the image, AIC for a normal distribution (i.e., the correct answer) was only selected to be better than a uniform distribution 395 times out of 1000 trials or 39.5% of the time for $n=5$. This increased to 949 times out of 1000 trials for $n=100$, a value still having an error rate of slightly more than 5%. It is said that AIC is asymptotically correct, and that appears to be correct. BTW, BIC makes the same choices for both 2 parameter models as AIC. But is that useful for small to moderately sized values of $n$?

The question mayAbove is an example of observed probability of model selection. It is claimed that the likelihood of AIC choosing a correct model is as follows:

The quantity $\exp\frac{\text{AIC}_{min} − \text{AIC}_i}{2}$ is known as the relative likelihood of model $i$. It is closely related to the likelihood ratio used in the likelihood-ratio test. Indeed, if all the models in the candidate set have the same number of parameters, then using AIC might at first appear to be very similar to using the likelihood-ratio test. There are, however, important distinctions. In particular, the likelihood-ratio test is valid only for nested models, whereas AIC (and AICc) has no such restriction.

Now note that the likelihood above can be difficult to understand without posting any answer at allreciprocated. HoweverThat is, if model A is twice as likely as model B, then model B is one-half as likely as model A. In the current context, we are not dealing with likelihoods, we created a Monte Carlo simulation with truth data, such that we observed the probability of making the correct choices. We have observed in this simulation that the likelihood of making the correct choice is heavily influenced by $n$, the number of observations, and that unless $n$ is large, we did not seem to get reliable answers.

I would really rather someone else answer this question, and will happily award the bounty to anyone who can take me out of the echo chamber of my talking to myself.

Suppose one generates values from a standard normal distribution, $\mathcal{N}(0,1)$. If we have only generated two values, $n=2$, then we have a discrete uniform distribution, not a convincingly discrete approximation of a normal distribution. Indeed, this is true for any $n=2$, no matter which generating distribution gave rise to those values, a discrete uniform distribution is a default result. Normal and uniform distributions are non-nested with respected to each other. Indeed, they have very different shapes. If we generate $\mathcal{N}(0,1)$ for increasing $n$ and examine AIC for fitting with a normal distribution versus a uniform distribution, even though we know that our generating function is $\mathcal{N}(0,1)$, AIC will not always be lesser for a normal distribution fit than for a uniform distribution fit. The plot below shows how many times out of 1000 repetitions AIC for a normal distribution model was better (less than) AIC for a uniform distribution model for $n$ varying from $n=5$ to $n=100$.

enter image description here

As can be seen in the image, AIC for a normal distribution (i.e., the correct answer) was only selected to be better than a uniform distribution 395 times out of 1000 trials or 39.5% of the time for $n=5$. This increased to 949 times out of 1000 trials for $n=100$, a value still having an error rate of slightly more than 5%. It is said that AIC is asymptotically correct, and that appears to be correct. But is that useful for small to moderately sized values of $n$?

The question may be difficult to understand without posting any answer at all. However, I would really rather someone else answer this question, and will happily award the bounty to anyone who can take me out of the echo chamber of my talking to myself.

Suppose one generates values from a standard normal distribution, $\mathcal{N}(0,1)$. If we have only generated two values, $n=2$, then we have a discrete uniform distribution, not a convincingly discrete approximation of a normal distribution. Indeed, this is true for any $n=2$, no matter which generating distribution gave rise to those values, a discrete uniform distribution is a default result. Normal and uniform distributions are non-nested with respected to each other. Indeed, they have very different shapes. If we generate $\mathcal{N}(0,1)$ for increasing $n$ and examine AIC for fitting with a normal distribution versus a uniform distribution, even though we know that our generating function is $\mathcal{N}(0,1)$, AIC will not always be lesser for a normal distribution fit than for a uniform distribution fit. The plot below shows how many times out of 1000 repetitions AIC for a normal distribution model was better (less than) AIC for a uniform distribution model for $n$ varying from $n=5$ to $n=100$.

enter image description here

As can be seen in the image, AIC for a normal distribution (i.e., the correct answer) was only selected to be better than a uniform distribution 395 times out of 1000 trials or 39.5% of the time for $n=5$. This increased to 949 times out of 1000 trials for $n=100$, a value still having an error rate of slightly more than 5%. It is said that AIC is asymptotically correct, and that appears to be correct. BTW, BIC makes the same choices for both 2 parameter models as AIC. But is that useful for small to moderately sized values of $n$?

Above is an example of observed probability of model selection. It is claimed that the likelihood of AIC choosing a correct model is as follows:

The quantity $\exp\frac{\text{AIC}_{min} − \text{AIC}_i}{2}$ is known as the relative likelihood of model $i$. It is closely related to the likelihood ratio used in the likelihood-ratio test. Indeed, if all the models in the candidate set have the same number of parameters, then using AIC might at first appear to be very similar to using the likelihood-ratio test. There are, however, important distinctions. In particular, the likelihood-ratio test is valid only for nested models, whereas AIC (and AICc) has no such restriction.

Now note that the likelihood above can be reciprocated. That is, if model A is twice as likely as model B, then model B is one-half as likely as model A. In the current context, we are not dealing with likelihoods, we created a Monte Carlo simulation with truth data, such that we observed the probability of making the correct choices. We have observed in this simulation that the likelihood of making the correct choice is heavily influenced by $n$, the number of observations, and that unless $n$ is large, we did not seem to get reliable answers.

I would really rather someone else answer this question, and will happily award the bounty to anyone who can take me out of the echo chamber of my talking to myself.

added 156 characters in body
Source Link
Carl
  • 13.3k
  • 7
  • 55
  • 115
Loading
added 119 characters in body
Source Link
Carl
  • 13.3k
  • 7
  • 55
  • 115
Loading
added 50 characters in body
Source Link
Carl
  • 13.3k
  • 7
  • 55
  • 115
Loading
added 20 characters in body
Source Link
Carl
  • 13.3k
  • 7
  • 55
  • 115
Loading
Source Link
Carl
  • 13.3k
  • 7
  • 55
  • 115
Loading