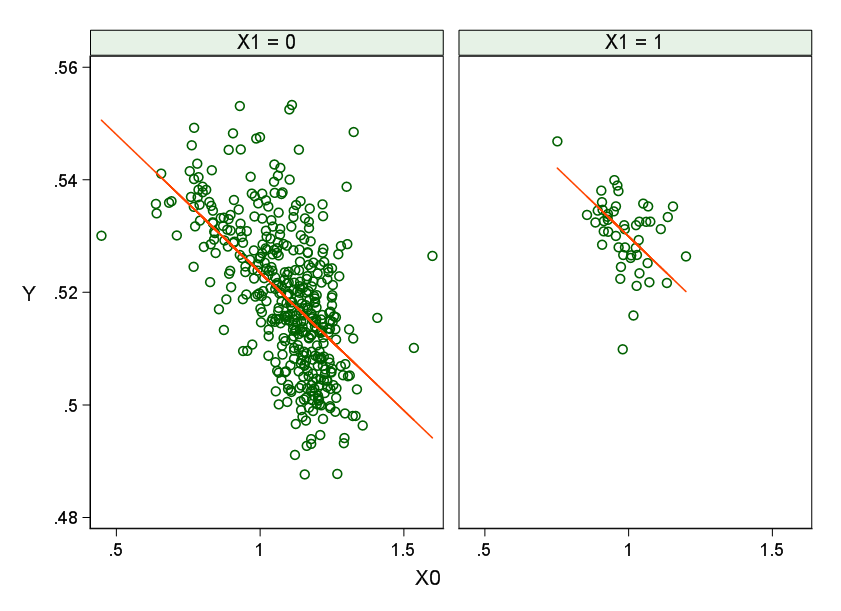
A regression model $Y = a + b_0 X_0 + b_1 X_1$ (the slightly awkward and non-standard notation matches your predictor names) plots as $a + b_0 X_0$ for $X_1 = 0$ and $a + b_0 X_0 + b_1$ for $X_1 = 1$, i.e. two parallel lines in $X_0, Y$ space. Here you can see a tilt in the main cluster of points which does not match the regression especially well, but you can also see that data points in the NE and E corners of each plot exert leverage pulling up the regression surface.
Although not shown here, a quadratic in $X_0$ (with $X_1$ as extra predictor in the same way) does not seem to offer worthwhile improvement. I don't have other models to suggest, nor do I suggest any transformations. It's absolute that $X_1$ cannot be transformed usefully (as any pair of values other than 0 and 1 would yield equivalent models), while it's hard to envisage a useful transformation for $Y$ given its narrow range. $X_0$ is the most obvious focus of attention.
The narrow range of the outcome from about 0.48 to 0.55 seems unusual, at least until the OP offers some kind of explanation. We have no context here on what kinds of relationship are substantively possible or plausible (or conversely impossible or implausible).
I can't reproduce yourFor $R^2$. Stata gives me 0.3725.

