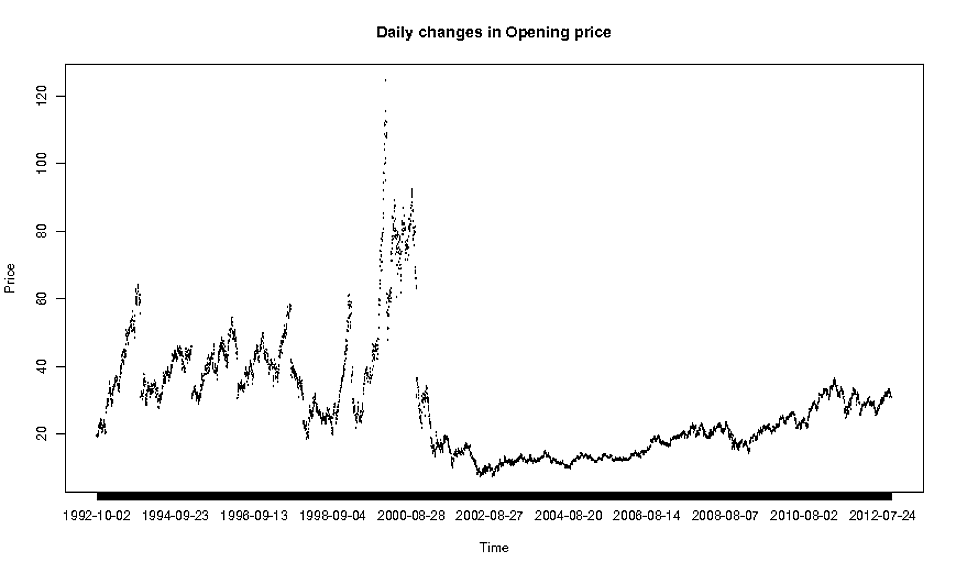
I have the following dataset: https://dl.dropbox.com/u/22681355/ORACLE.csv and would like to plot the daily changes in 'Open' by 'Date', so I did the following:
oracle = read.csv(file="/ORACLE.csv", head=TRUE)
plot(oracle$Date, oracle$Open, type="l")
oracle <- read.csv(file="http://dl.dropbox.com/u/22681355/ORACLE.csv", header=TRUE)
plot(oracle$Date, oracle$Open, type="l")
and I get the following: https://dl.dropbox.com/u/22681355/plot.pdf

Now this is obviously not the nicest plot ever, so I'm wondering what is the right method to use when plotting such detailed data?
