deleted 2 characters in body; edited title
Source Link
Nick Cox
  • 59.5k
  • 8
  • 136
  • 212

Intrepreting Interpreting this KM Curve

I would like for someone experienced to look at my KM curve. I have categorized a continuous clinical variable into 2 groups based on its median. The Log rank test is significant (p=0.0052).

I have then made models using Cox regression (PH assumptions checked) with known confounders. For the coxCox regression, I treated this variable as continuous.

Can anyone tell me if the blue curve is somehow distorting the picture? The survival times distribution could influence this  , correct? I plan to present adjusted survival curves based offon the PROC PHREG (coxCox regression) but I want to know how this raw survival curve stands.

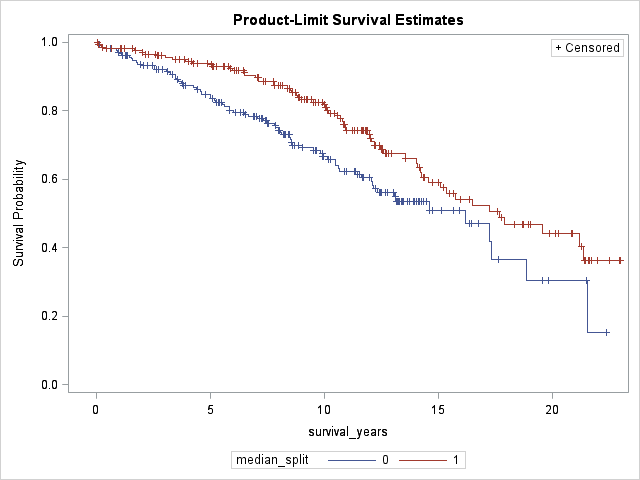
KM curve using PROC LIFETEST

Intrepreting this KM Curve

I would like for someone experienced to look at my KM curve. I have categorized a continuous clinical variable into 2 groups based on median. The Log rank test is significant (p=0.0052).

I have then made models using Cox regression (PH assumptions checked) with known confounders. For the cox regression, I treated this variable as continuous.

Can anyone tell me if the blue curve is somehow distorting the picture? The survival times distribution could influence this  , correct? I plan to present adjusted survival curves based off the PROC PHREG (cox regression) but I want to know how this raw survival curve stands.

KM curve using PROC LIFETEST

Interpreting this KM Curve

I would like someone experienced to look at my KM curve. I have categorized a continuous clinical variable into 2 groups based on its median. The Log rank test is significant (p=0.0052).

I have then made models using Cox regression (PH assumptions checked) with known confounders. For the Cox regression, I treated this variable as continuous.

Can anyone tell me if the blue curve is somehow distorting the picture? The survival times distribution could influence this, correct? I plan to present adjusted survival curves based on the PROC PHREG (Cox regression) but I want to know how this raw survival curve stands.

KM curve using PROC LIFETEST

Source Link
mindhabits
  • 367
  • 3
  • 17

Intrepreting this KM Curve

I would like for someone experienced to look at my KM curve. I have categorized a continuous clinical variable into 2 groups based on median. The Log rank test is significant (p=0.0052).

I have then made models using Cox regression (PH assumptions checked) with known confounders. For the cox regression, I treated this variable as continuous.

Can anyone tell me if the blue curve is somehow distorting the picture? The survival times distribution could influence this , correct? I plan to present adjusted survival curves based off the PROC PHREG (cox regression) but I want to know how this raw survival curve stands.

KM curve using PROC LIFETEST