I am new to time series ananlysisanalysis, I tried first to decompose my data using the decompose function in R. Hope I, hoping I'd get a stationary data in tehthe random obtained, I. I'm planning to fit an ARIMA model to it.
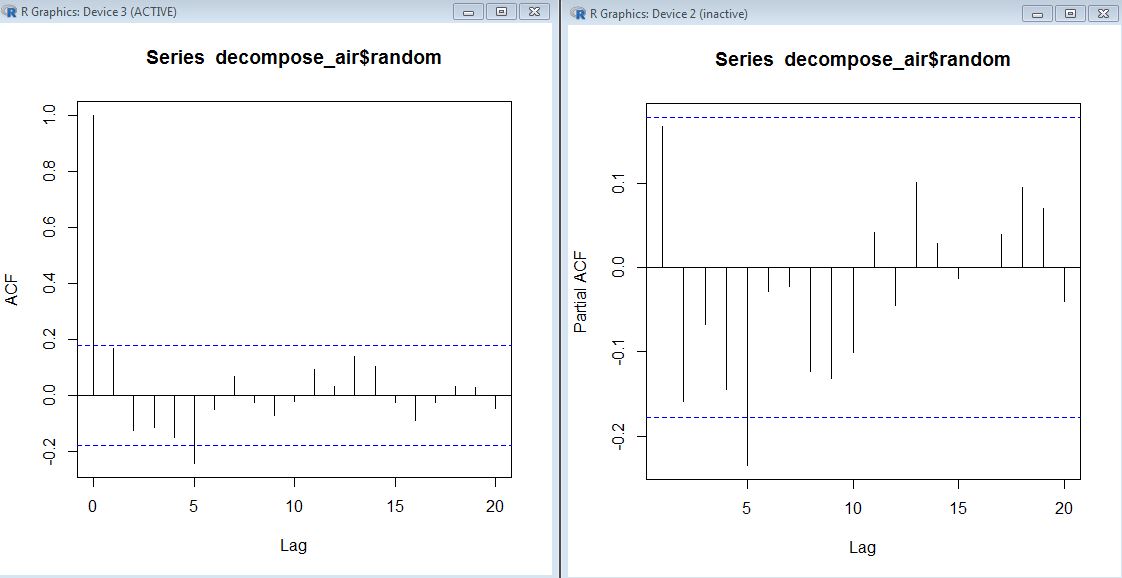
But when I plot the ACF and the PACF oftheof the random error obtained from decomposing I got tehthe foloowing autocorrelogramcorrelogram plots: [![enter image description here][1]][1]
I am not able to detetrminedetermine from thsesthese plots the nature oftheof the obtained error, and the order of tehthe ARIMA model that I shoudlshould use.
Would some onesomeone help me in analysing the obtaiendobtained plots.? I would prefer if there is a reference ( bookbook, paper, link..) that could help me.
Thank you in adavnce. [1]: https://i.sstatic.net/VUbfe.jpg
