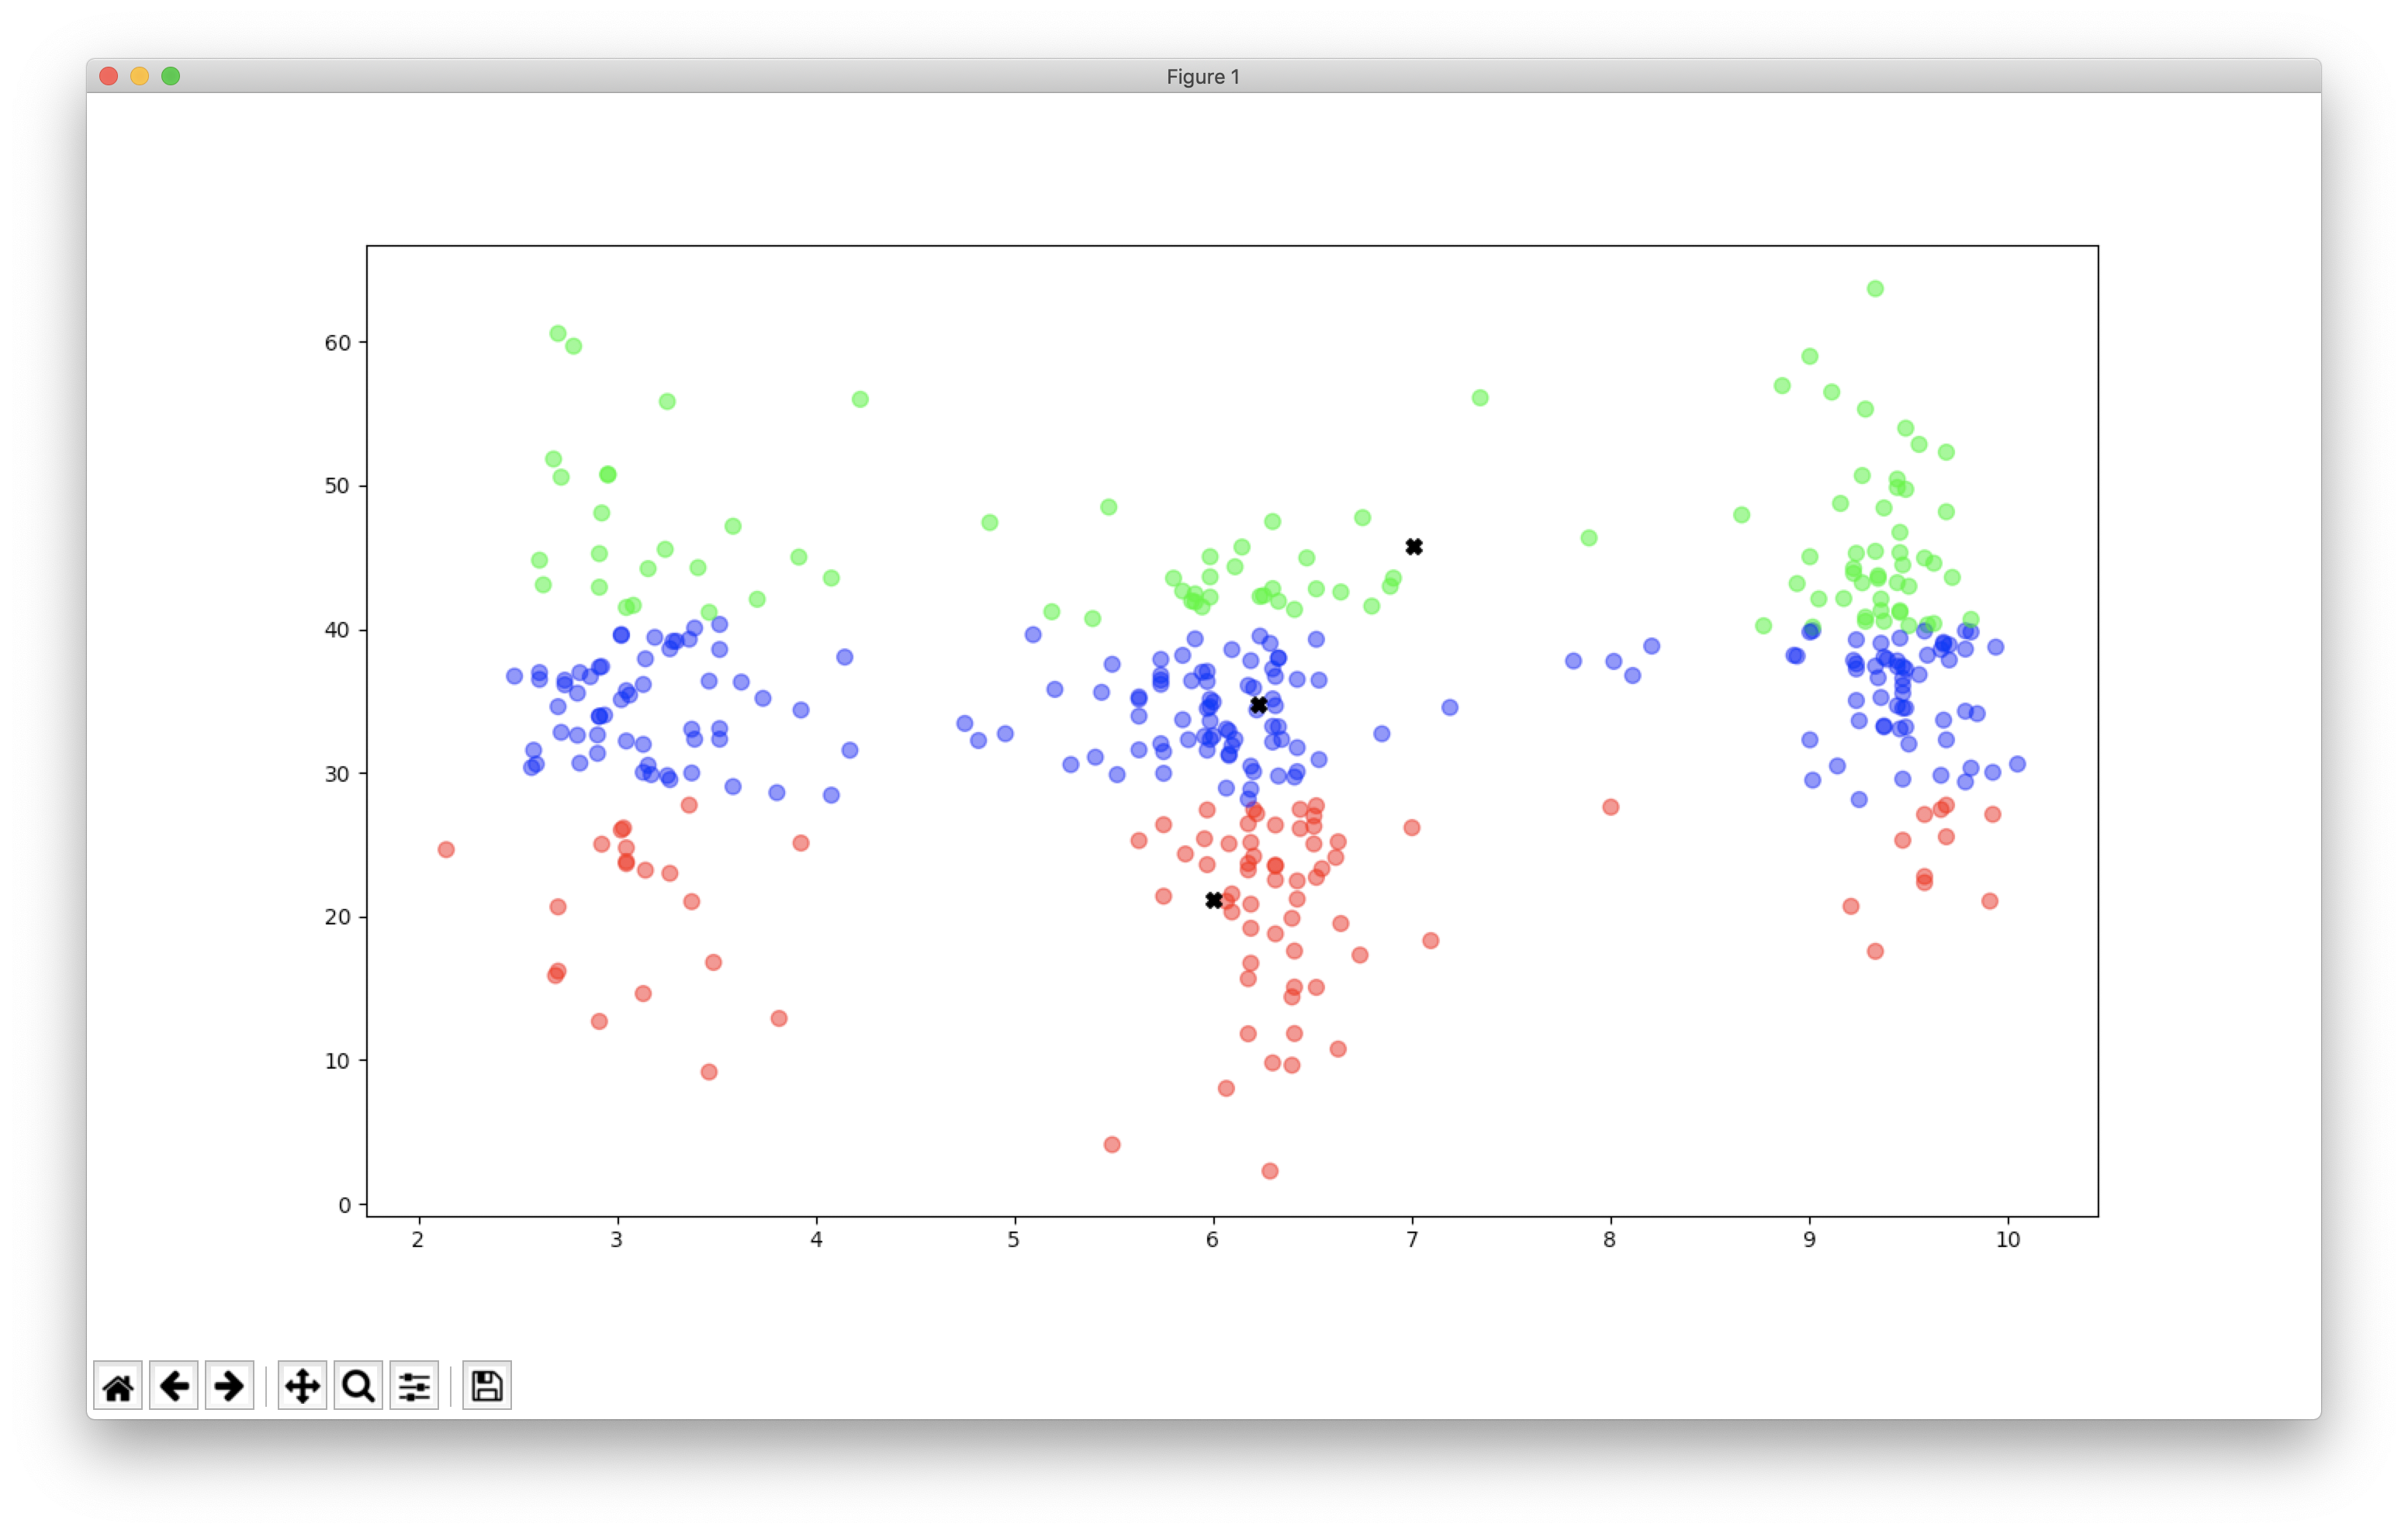
Your intuition is not objective.
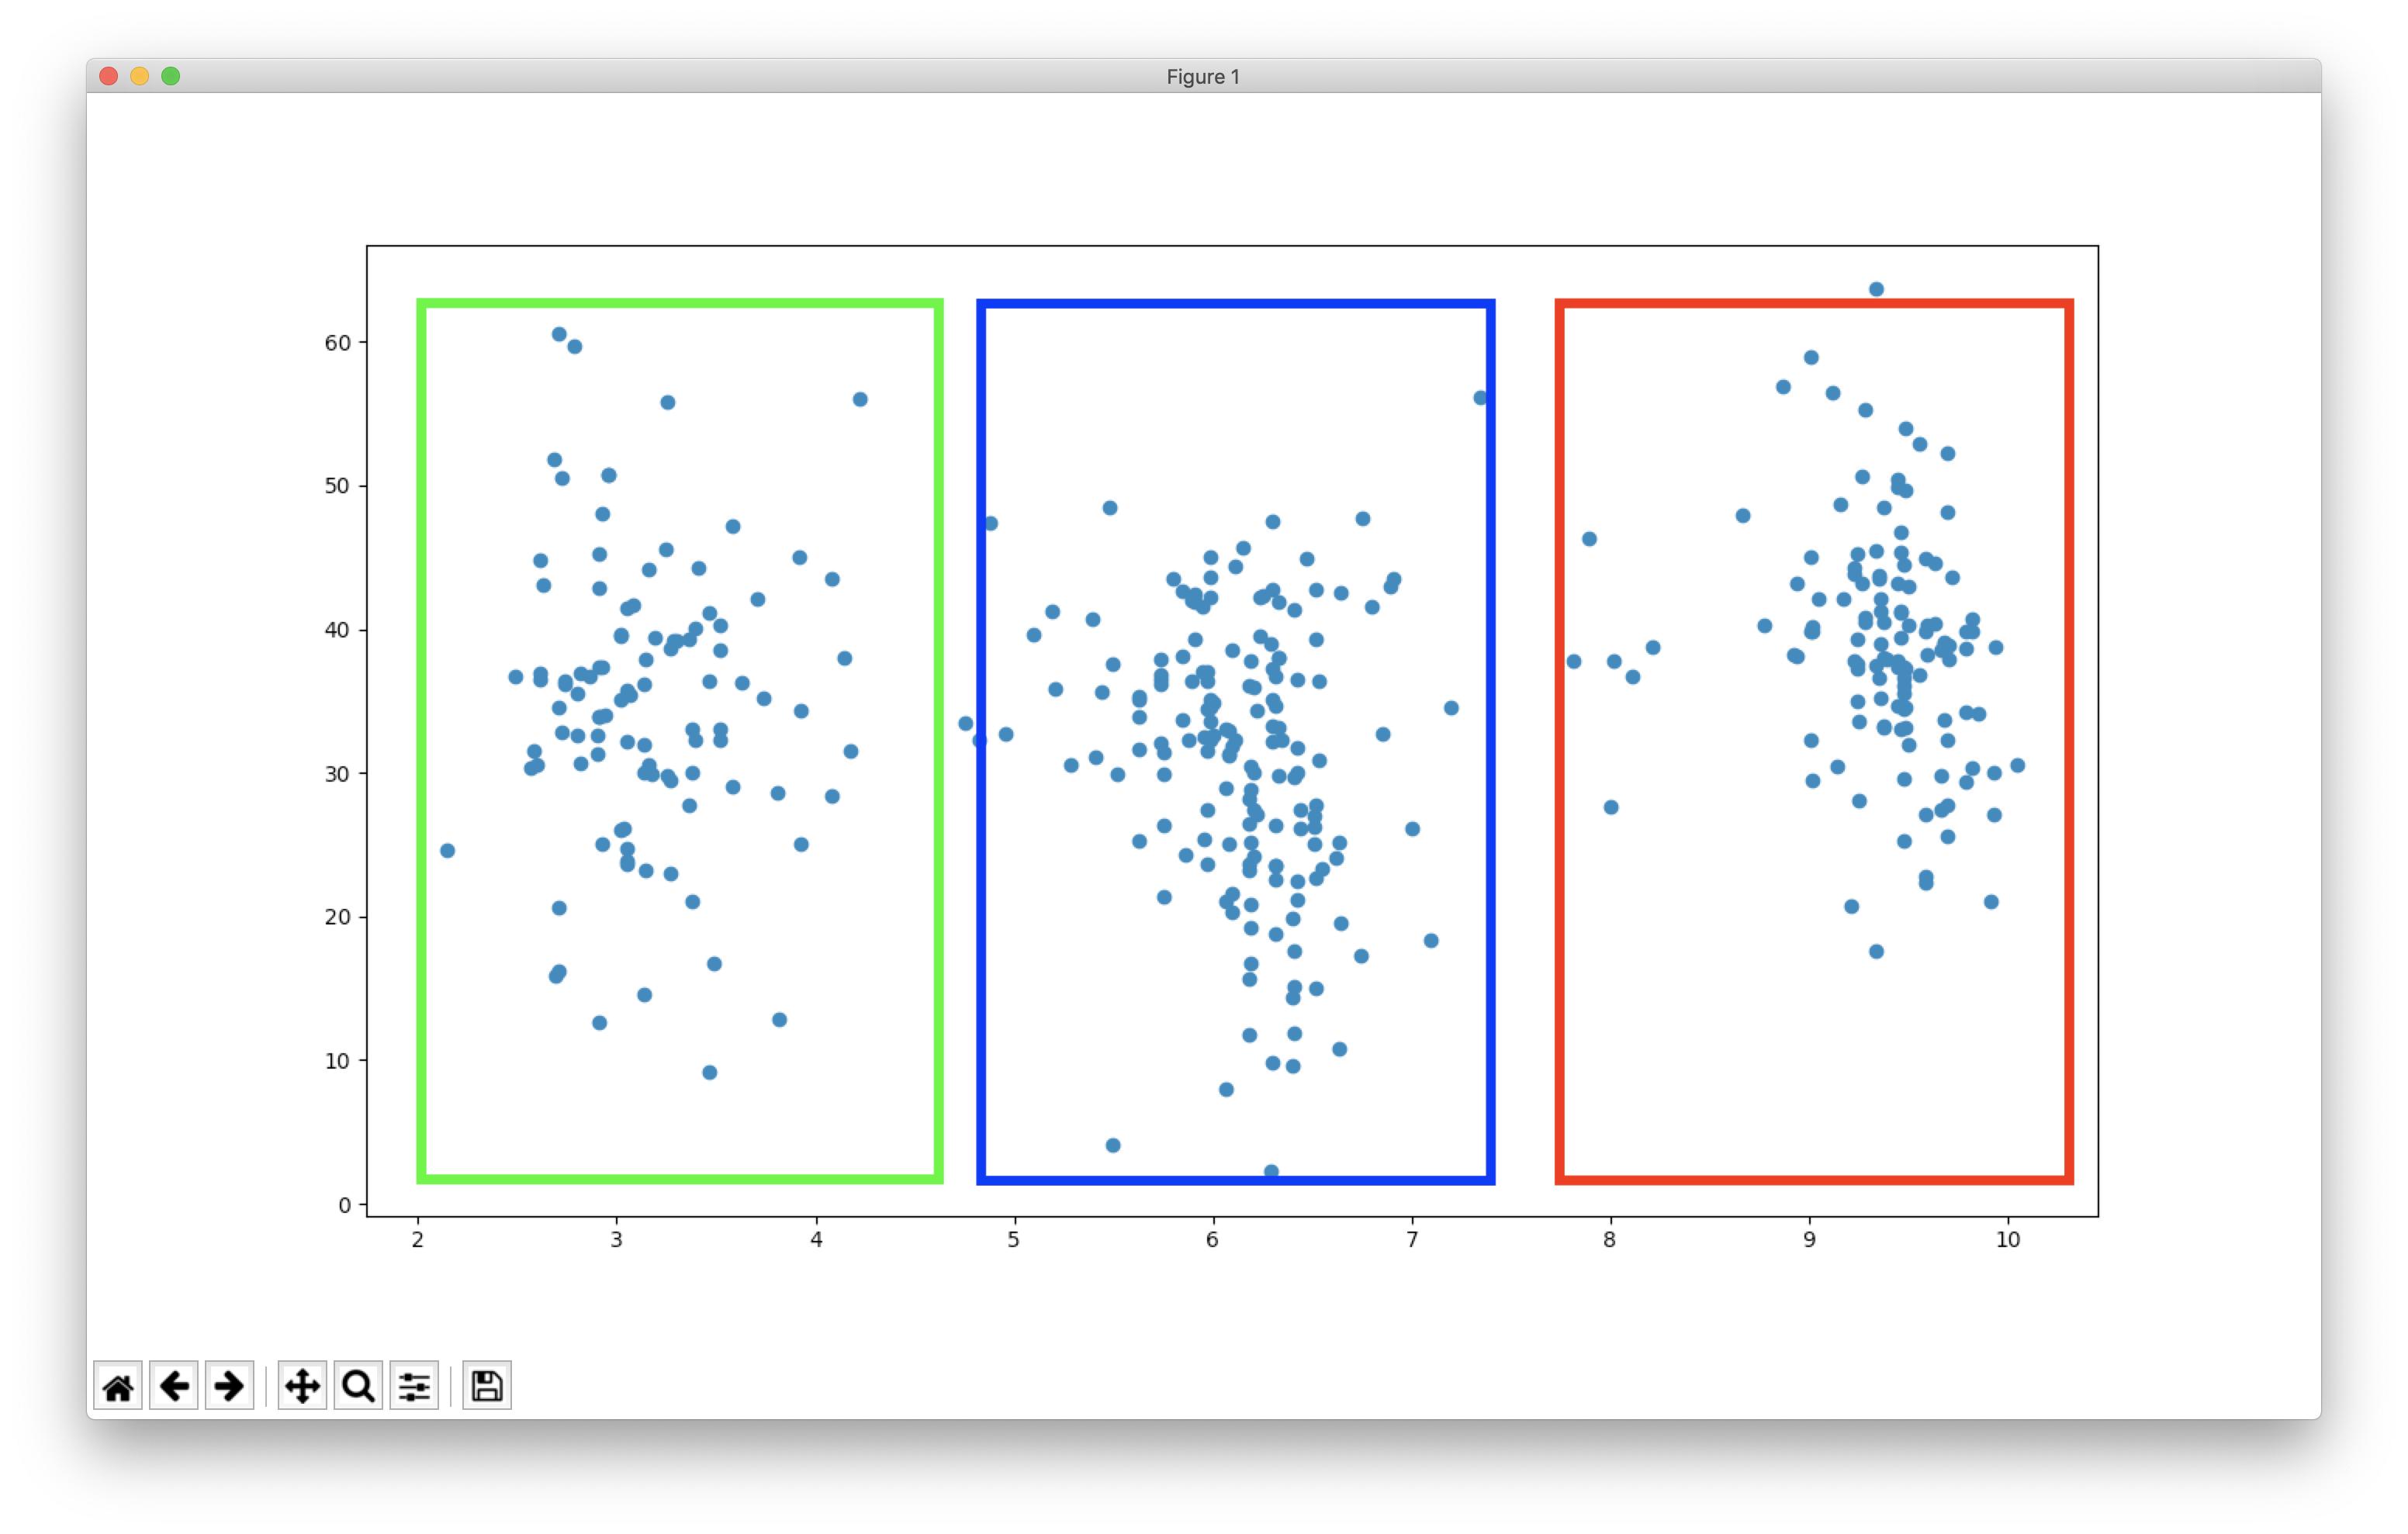
You are being misleadmisled by a bad plot. Your data actually looks more like this:


Are you still convinced your "intuitive" solution is better? Split your data with a threshold on the x axis, and compute the cost function.
Just kidding. Normalize your data and this toy example will work.
If you intend to incorporate user feedback, metric learning may be worth looking into. If you learn a linear transformation, you can run k-means on the scaled data. Have a user select instances from the same and from different clusters to learn the projection.
