added 4 characters in body
Source Link
Gavin Simpson
  • 50.4k
  • 8
  • 136
  • 185

I have a dataset of marine debris items (number of items standardized per effort: Items/(number of volunteersHoursLenght * Hours * Length)) taken from 2 main locations (WA and Queensland) in Australia (8 Sub Sites in total: 4 in WA and 4 in Queensland) at irregular sampling intervals over a period 15 years.

I have a dataset of marine debris items (number of items standardized per effort: Items/(number of volunteersHoursLenght)) taken from 2 main locations (WA and Queensland) in Australia (8 Sub Sites in total: 4 in WA and 4 in Queensland) at irregular sampling intervals over a period 15 years.

I have a dataset of marine debris items (number of items standardized per effort: Items/(number of volunteers * Hours * Length)) taken from 2 main locations (WA and Queensland) in Australia (8 Sub Sites in total: 4 in WA and 4 in Queensland) at irregular sampling intervals over a period 15 years.

clean-up the code block
Source Link
Gavin Simpson
  • 50.4k
  • 8
  • 136
  • 185
m4<m4 <- gamm(Ieffort ~ s(DaysIa)+MARPOL++ MARPOL + s(nMonth, bs = "ps", k = 12), random=list
           random = list(Site=~1Site = ~1,Location=~1 Location = ~1), data = d)
m4<- gamm(Ieffort ~ s(DaysIa)+MARPOL+ s(nMonth, bs = "ps", k = 12), random=list(Site=~1,Location=~1),data = d)
m4 <- gamm(Ieffort ~ s(DaysIa)+ MARPOL + s(nMonth, bs = "ps", k = 12), 
           random = list(Site = ~1, Location = ~1), data = d)
added 172 characters in body
Source Link

I have a dataset of marine debris items (number of items standardized per effort: Items/(number of volunteersHoursLenght)) taken from 2 main locations (WA and Queensland) in Australia (8 Sub Sites in total: 4 in WA and 4 in Queensland) at irregular sampling intervals over a period 15 years.

I want to test if there is a change over the years on the amount of debris in these locations and more specifically a change after the implementation of a mitigation strategy (in 2013).

Here’s the head of the data:
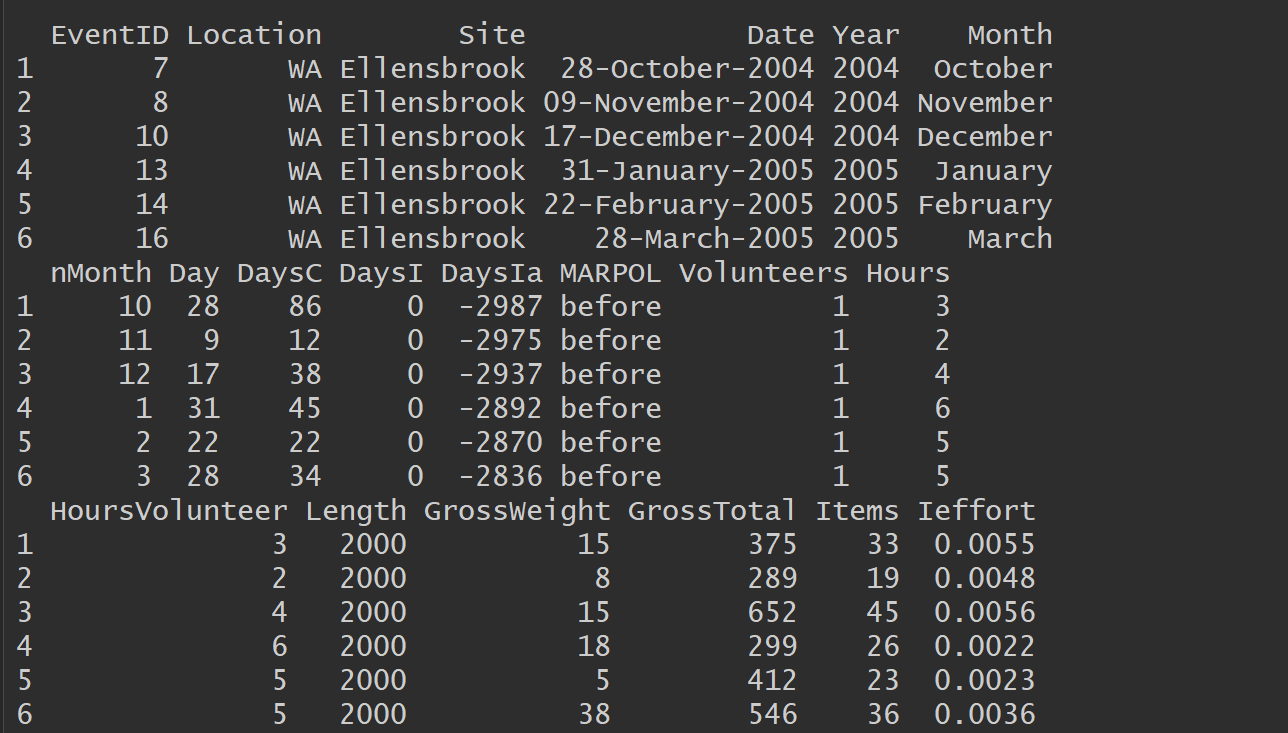
enter image description here

Description of each one of the varables in the dataframe:

eventid = each sampling (clean-up) event
Location = Queensland and New South Wales
Sites = all the 9 sampling beaches

Date = specific dates for the clean-up events (day-month-year)
Date1 = specific dates for the clean-up events (day-month-year) on the POSICXT format
Year= Year of sampling event (2004 to 2018)
Month= Month of the sampling event (jan to dec)
nMonth= a number was determined to the respective month of the sampling event (1 to 12)
Day= Day of sampling (1 to 31)
Days = Days since the first date of clean up = just another way of using the dates

MARPOL = before and after implementation (factor with 2 levels)
DaysC = days between sampling events for the same sites = number of days since the previous clean-up event
DaysI = Days since intervention, all the dates before implementation are zero, and after we count the number of days since the implementation date (1 jan 2013)
DaysIa= same as DayI but instead of zero for before the intervention we have negative values (days)

Items = number of fishing and shipping items counted in each clean-up event
Hours = hours spent by all volunteers together at each clean up event
Lenght = Lenght of beach sampled by all volunteers together at each clean up event
volunteers = all volunteers at each clean up event
HoursVolunteer = hours spent bt each volunteer at each clean up event (Hours/volunteers)
Ieffort = the items standarized by the effort (hours, volunteers and lenght)

GrossWeight = total weight of the all the items found (not just fishing and shipping debris)
GrossTotal = total amount of the all the items found (not just fishing and shipping debris)


Problems:

My data has a few problems:

  1. I think I will need to fix the effects of seasonal variation (Monthly) and .
  2. of possible spatial correlation (probability of finding an item is higher after finding one since they can come from the same ship).
  3. How do I handle the fact that the measurements were not taken at a regular interval?

I was trying to use GAMs to analyse the data and see the trends over time. The model I came across is the following:

m4<- gamm(Ieffort ~ s(DaysIa)+MARPOL+ s(nMonth, bs = "ps", k = 12), random=list(Site=~1,Location=~1),data = d)

How can I handle the fact that the measurements were not taken at a regular interval, the seasonality and the possible spatial correlation? Am I on the right track?

I have a dataset of marine debris items (number of items standardized per effort: Items/(number of volunteersHoursLenght)) taken from 2 main locations (WA and Queensland) in Australia (8 Sub Sites in total: 4 in WA and 4 in Queensland) at irregular sampling intervals over a period 15 years.

I want to test if there is a change over the years on the amount of debris in these locations and more specifically a change after the implementation of a mitigation strategy (in 2013).

Here’s the head of the data:

enter image description here

Description of each one of the varables in the dataframe:

eventid = each sampling (clean-up) event
Location = Queensland and New South Wales
Sites = all the 9 sampling beaches

Date = specific dates for the clean-up events (day-month-year)
Date1 = specific dates for the clean-up events (day-month-year) on the POSICXT format
Year= Year of sampling event (2004 to 2018)
Month= Month of the sampling event (jan to dec)
nMonth= a number was determined to the respective month of the sampling event (1 to 12)
Day= Day of sampling (1 to 31)
Days = Days since the first date of clean up = just another way of using the dates

MARPOL = before and after implementation (factor with 2 levels)
DaysC = days between sampling events for the same sites = number of days since the previous clean-up event
DaysI = Days since intervention, all the dates before implementation are zero, and after we count the number of days since the implementation date (1 jan 2013)
DaysIa= same as DayI but instead of zero for before the intervention we have negative values (days)

Items = number of fishing and shipping items counted in each clean-up event
Hours = hours spent by all volunteers together at each clean up event
Lenght = Lenght of beach sampled by all volunteers together at each clean up event
volunteers = all volunteers at each clean up event
HoursVolunteer = hours spent bt each volunteer at each clean up event (Hours/volunteers)
Ieffort = the items standarized by the effort (hours, volunteers and lenght)

GrossWeight = total weight of the all the items found (not just fishing and shipping debris)
GrossTotal = total amount of the all the items found (not just fishing and shipping debris)


Problems:

My data has a few problems:

  1. I think I will need to fix the effects of seasonal variation (Monthly) and .
  2. of possible spatial correlation (probability of finding an item is higher after finding one since they can come from the same ship).
  3. How do I handle the fact that the measurements were not taken at a regular interval?

I was trying to use GAMs to analyse the data and see the trends over time. The model I came across is the following:

m4<- gamm(Ieffort ~ s(DaysIa)+MARPOL+ s(nMonth, bs = "ps", k = 12), random=list(Site=~1,Location=~1),data = d)

How can I handle the fact that the measurements were not taken at a regular interval, the seasonality and the possible spatial correlation? Am I on the right track?

Source Link
Loading