edited body
Source Link
Siong Thye Goh
  • 7k
  • 3
  • 21
  • 31

I would like to construct a survival curve from retrospectively gathered data that represents the time to onset (t$t$) of disease (d$d$) after some specific event (x$x$).

We know that x$x$ predisposes to d$d$ so we want to explore how t$t$ and d$d$ are related after x$x$ occurs.

The problem is that x$x$ can occur at any age and the risk of d$d$ (even without x$x$ occurring) increases with age. Furthermore, some of the study population already had d$d$ when x$x$ occurred.

Below is a plot I constructed that represents the diagnosis of d$d$ in all patients that were not already diagnosed with d$d$ and suffered x$x$ at t=0$t=0$.

However, some of these patients likely would have developed d$d$ anyway just given the age of that patient at t=0$t=0$. I am unsure of the most responsible way to control for this confounding variable in my survival analysis.

I'm sure this is actually a more complicated question than what I am making it out to be. Additional resources would great.

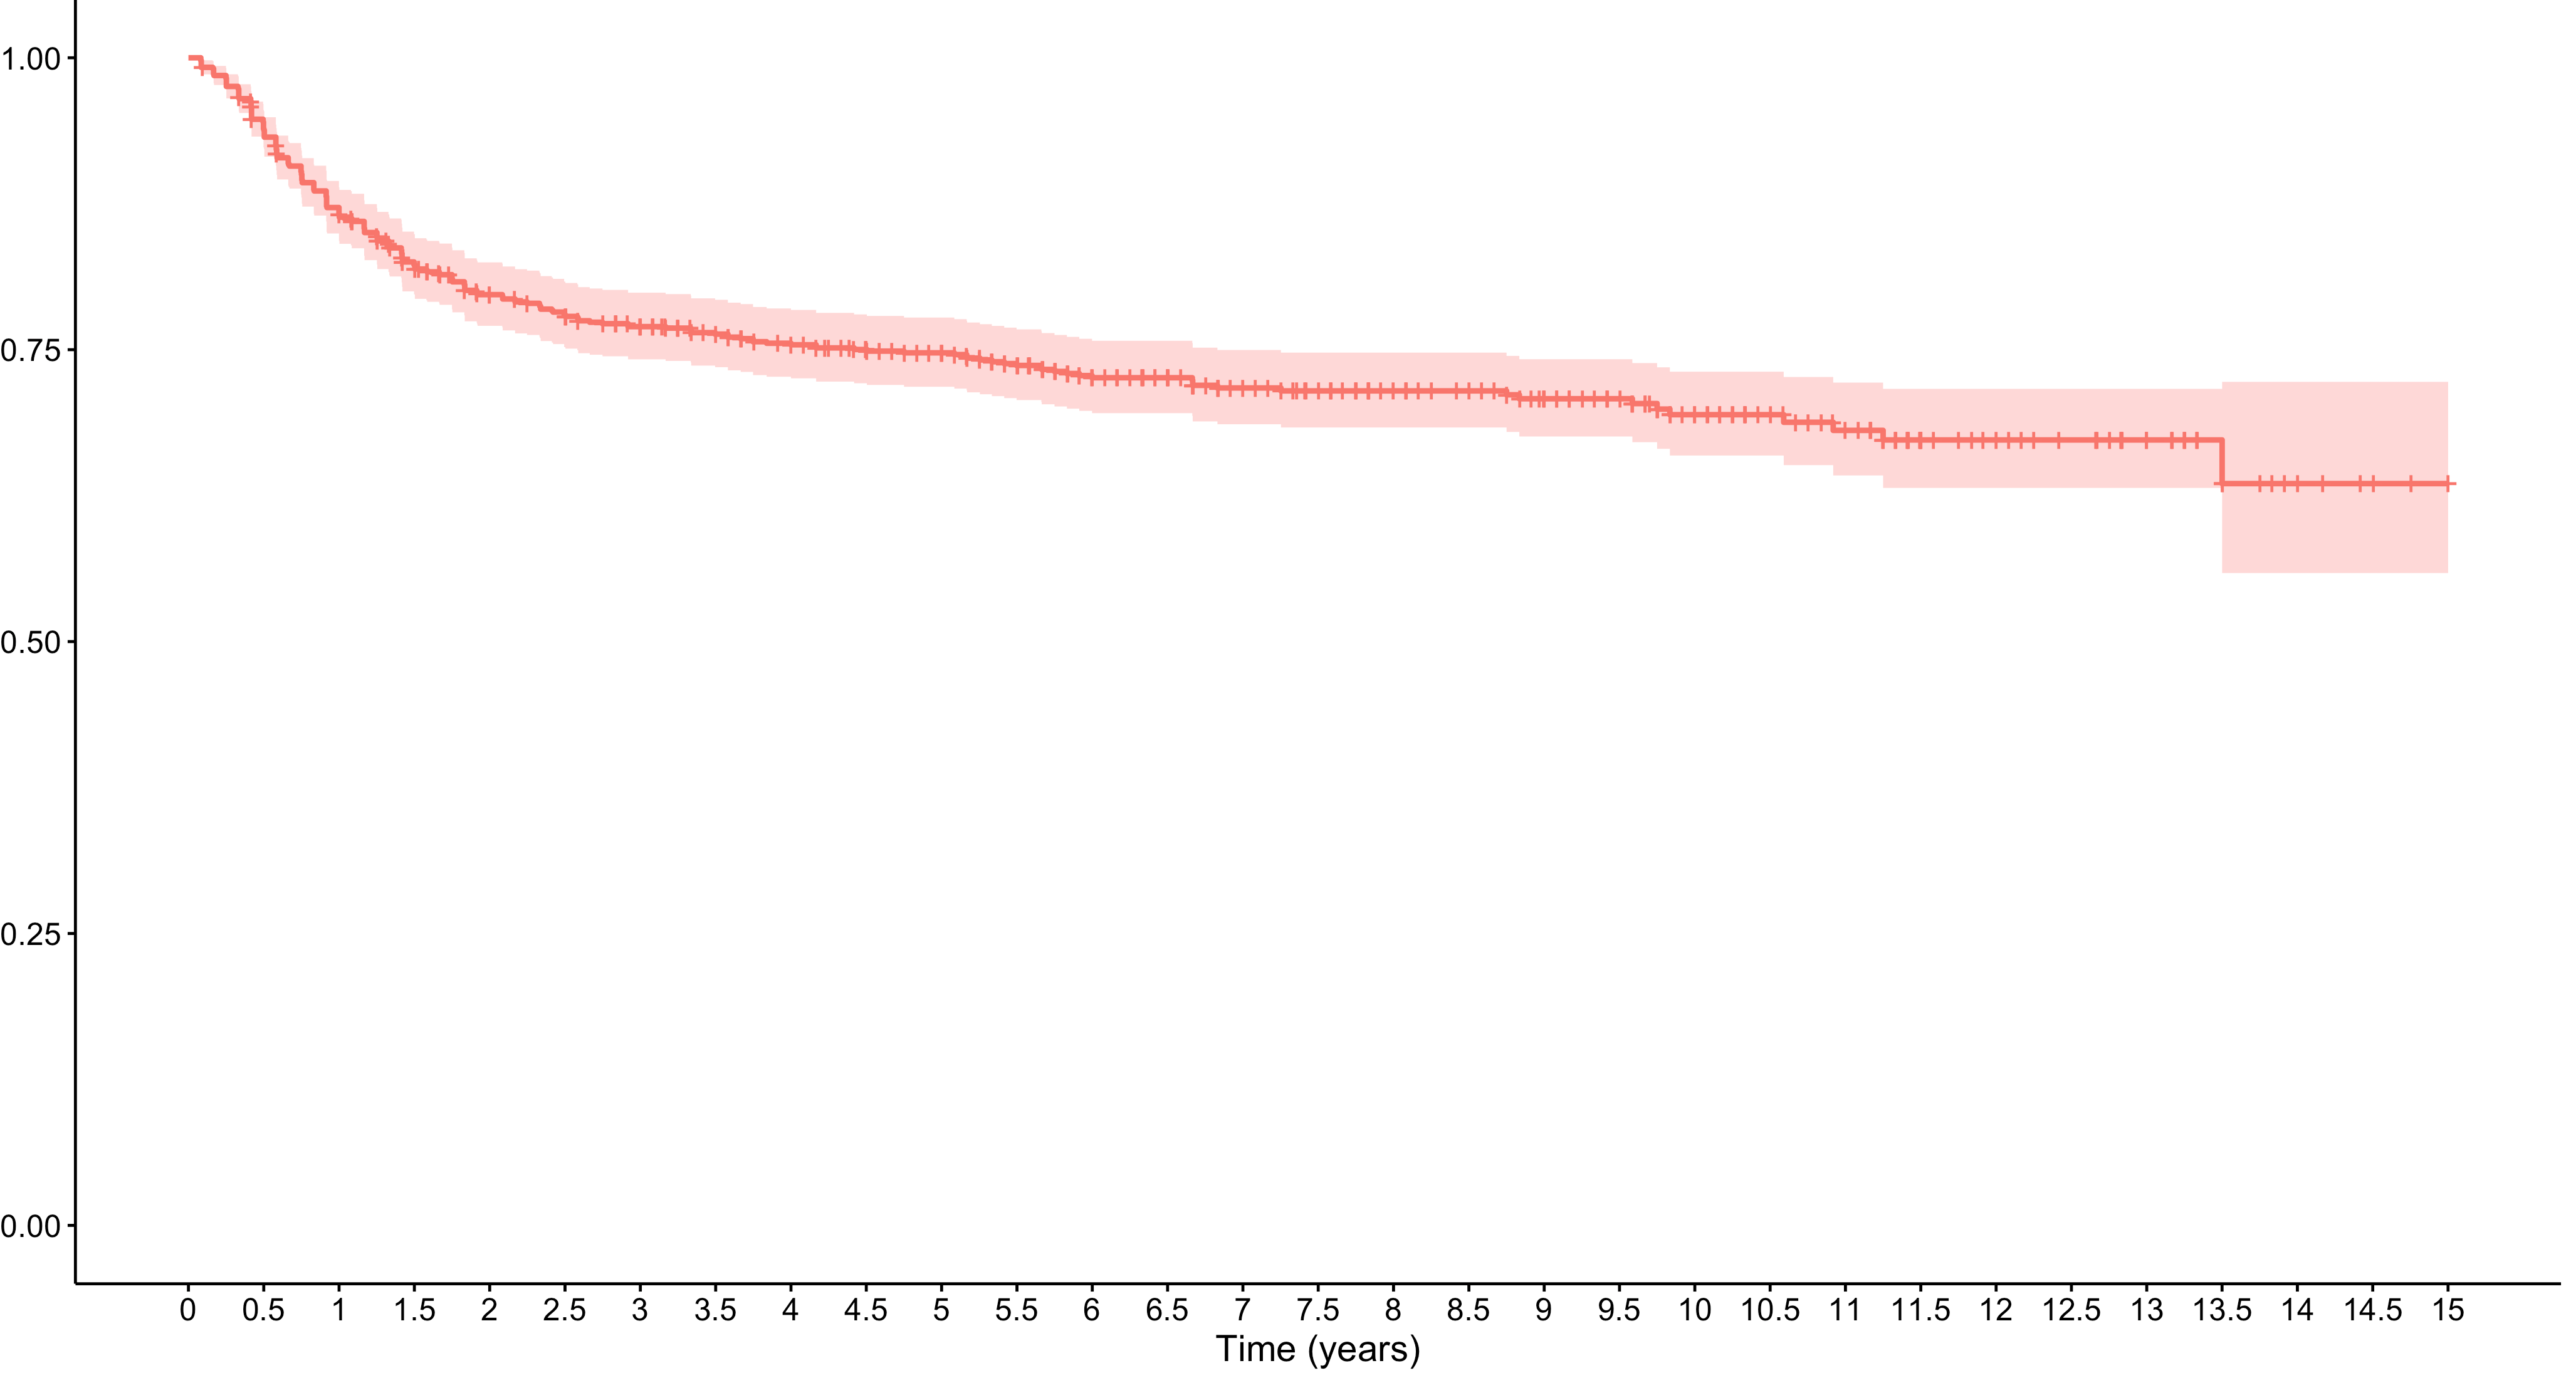
surival plot

I would like to construct a survival curve from retrospectively gathered data that represents the time to onset (t) of disease (d) after some specific event (x).

We know that x predisposes to d so we want to explore how t and d are related after x occurs.

The problem is that x can occur at any age and the risk of d (even without x occurring) increases with age. Furthermore, some of the study population already had d when x occurred.

Below is a plot I constructed that represents the diagnosis of d in all patients that were not already diagnosed with d and suffered x at t=0.

However, some of these patients likely would have developed d anyway just given the age of that patient at t=0. I am unsure of the most responsible way to control for this confounding variable in my survival analysis.

I'm sure this is actually a more complicated question than what I am making it out to be. Additional resources would great.

surival plot

I would like to construct a survival curve from retrospectively gathered data that represents the time to onset ($t$) of disease ($d$) after some specific event ($x$).

We know that $x$ predisposes to $d$ so we want to explore how $t$ and $d$ are related after $x$ occurs.

The problem is that $x$ can occur at any age and the risk of $d$ (even without $x$ occurring) increases with age. Furthermore, some of the study population already had $d$ when $x$ occurred.

Below is a plot I constructed that represents the diagnosis of $d$ in all patients that were not already diagnosed with $d$ and suffered $x$ at $t=0$.

However, some of these patients likely would have developed $d$ anyway just given the age of that patient at $t=0$. I am unsure of the most responsible way to control for this confounding variable in my survival analysis.

I'm sure this is actually a more complicated question than what I am making it out to be. Additional resources would great.

surival plot

Source Link

Control for baseline incidence of disease in Kaplan-Meier curve

I would like to construct a survival curve from retrospectively gathered data that represents the time to onset (t) of disease (d) after some specific event (x).

We know that x predisposes to d so we want to explore how t and d are related after x occurs.

The problem is that x can occur at any age and the risk of d (even without x occurring) increases with age. Furthermore, some of the study population already had d when x occurred.

Below is a plot I constructed that represents the diagnosis of d in all patients that were not already diagnosed with d and suffered x at t=0.

However, some of these patients likely would have developed d anyway just given the age of that patient at t=0. I am unsure of the most responsible way to control for this confounding variable in my survival analysis.

I'm sure this is actually a more complicated question than what I am making it out to be. Additional resources would great.

surival plot