This is a relatively simple problem. The basic model to test your question about differences in slope is:
(m0 <- lm(Size ~ Time * Group, dat))
# Coefficients:
# (Intercept) Time GroupB GroupC Time:GroupB Time:GroupC
# 0.1700 0.3930 -0.1482 -0.1032 -0.2890 -0.2956
I have ignored the question about the intercepts. More on this at the end. Also, the basic model you ran does not permit testing of differences in slopes. If you perform the diagnostic tests you performed on the model m0 here, they do not confirm misspecification.
However, it appears Group A is on a different scale, so it makes sense to run a heteroskedastic model:
library(nlme)
(m1 <- gls(Size ~ Time * Group, dat,
           weights = varIdent(form = ~ 1 | I(Group == "A"))))
# Coefficients:
# (Intercept)        Time      GroupB      GroupC Time:GroupB Time:GroupC
#   0.1700000   0.3930000  -0.1482143  -0.1032143  -0.2889524  -0.2956190
#
# Variance function:
#  Structure: Different standard deviations per stratum
#  Formula: ~1 | I(Group == "A")
#  Parameter estimates:
#     TRUE    FALSE
# 1.000000 1.676464
We find that the residual standard deviations of the groups that are not group A are 68% greater than the residual standard deviation for group A.
To address your primary research questions, we can go:
library(emmeans)
pairs(emtrends(m1, ~ Group, var = "Time"))
#  contrast    estimate          SE df t.ratio p.value
#  A - B    0.288952381 0.009169459 14  31.512  <.0001
#  A - C    0.295619048 0.009169459 14  32.240  <.0001
#  B - C    0.006666667 0.006492917 14   1.027  0.5729
#
# P value adjustment: tukey method for comparing a family of 3 estimates
We find that there is not much statistical evidence to conclude that the slopes for Group B and C are different from each other. While there is the evidence to differentiate A from B, and A from C.
Since we have an interaction, it is difficult to consider differences in the intercept. Given the current analysis, the intercept relates to group differences at Time 0 which does not exist in the data, minimum Time is 1. The emmeans package provide an option to view differences between the groups at different values of time:
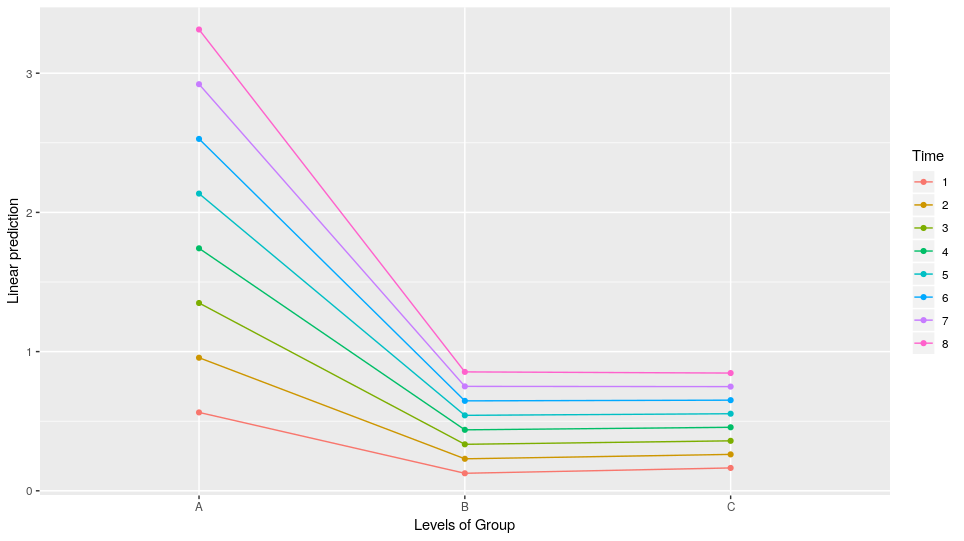
emmip(m1, Time ~ Group, cov.reduce = FALSE)

We find that as time increases, the group differences between A and B, and A and C increase. But B and C continue to be relatively similar. Be careful because there are no time point beyond time 4 for Group A, these are extrapolated values.
Given what we have learned, a parsimonous model would be:
m.pars <- gls(Size ~ Time * I(Group == "A"), dat,
              weights = varIdent(form = ~ 1 | I(Group == "A")))