improved formatting
Source Link
Stefan
  • 6.6k
  • 1
  • 24
  • 45

I am very new to R and I have a problem with the diagnostics of my models...can anyone help me please?

iI have run my model:

Modell_ia8<- glmer(vote~edu1 + age1+ female+eink1+scltrst+poltrst+links1 + links1:edu1 + rechts1 + rechts1:edu1+ (1|country), family = binomial(link="logit"),data=all)

Modell_ia8 <- glmer(vote~edu1 + age1 + female + eink1 + scltrst + poltrst + links1 +
                    links1:edu1 + rechts1 + rechts1:edu1 + (1|country),
                    family = binomial(link = "logit"), data = all)

then iThen I came across the DHARMaDHARMa package and did this:

simulationOutput1 <- simulateResiduals(fittedModel = Modell_ia8,n=100) plot(simulationOutput1)

simulationOutput1 <- simulateResiduals(fittedModel = Modell_ia8,n=100)
plot(simulationOutput1)

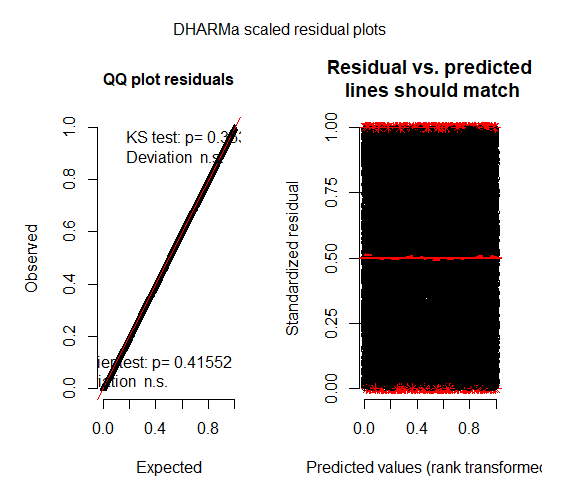
which gives me this: enter image description here

I guess the QQ Plot looks good but I do not understand the Residualresidual plot at all.:

  1. whyWhy is it all black?
  2. whatWhat do the read lines in the middle and at 0 and 1 mean?

thank you so much in advance!

Blerta

I am very new to R and I have a problem with the diagnostics of my models...can anyone help me please?

i have run my model:

Modell_ia8<- glmer(vote~edu1 + age1+ female+eink1+scltrst+poltrst+links1 + links1:edu1 + rechts1 + rechts1:edu1+ (1|country), family = binomial(link="logit"),data=all)

then i came across the DHARMa package and did this:

simulationOutput1 <- simulateResiduals(fittedModel = Modell_ia8,n=100) plot(simulationOutput1)

which gives me this: enter image description here

I guess the QQ Plot looks good but I do not understand the Residual plot at all.

  1. why is it all black?
  2. what do the read lines in the middle and at 0 and 1 mean?

thank you so much in advance!

Blerta
I am very new to R and I have a problem with the diagnostics of my models...can anyone help me please?

I have run my model:

Modell_ia8 <- glmer(vote~edu1 + age1 + female + eink1 + scltrst + poltrst + links1 +
                    links1:edu1 + rechts1 + rechts1:edu1 + (1|country),
                    family = binomial(link = "logit"), data = all)

Then I came across the DHARMa package and did this:

simulationOutput1 <- simulateResiduals(fittedModel = Modell_ia8,n=100)
plot(simulationOutput1)

which gives me this: enter image description here

I guess the QQ Plot looks good but I do not understand the residual plot at all:

  1. Why is it all black?
  2. What do the read lines in the middle and at 0 and 1 mean?
Source Link

Diagnostic plot of glmm model

I am very new to R and I have a problem with the diagnostics of my models...can anyone help me please?

i have run my model:

Modell_ia8<- glmer(vote~edu1 + age1+ female+eink1+scltrst+poltrst+links1 + links1:edu1 + rechts1 + rechts1:edu1+ (1|country), family = binomial(link="logit"),data=all)

then i came across the DHARMa package and did this:

simulationOutput1 <- simulateResiduals(fittedModel = Modell_ia8,n=100) plot(simulationOutput1)

which gives me this: enter image description here

I guess the QQ Plot looks good but I do not understand the Residual plot at all.

  1. why is it all black?
  2. what do the read lines in the middle and at 0 and 1 mean?

thank you so much in advance!

Blerta