added 213 characters in body
Source Link
IrishStat
  • 30k
  • 5
  • 36
  • 60

Let us review the assumptions that are made when it is safe to visually OR computationally map the sample acf and pacf to a useful arima model. Firstly there must be no deterministic structure latent in your data i.e. no pulses , no step/level shifts , no seasonal pulses and no time trends (often called Deterministic Trends) . Secondly the parameters of the IDENTIFIED (initially and repetitively) arima model must be invariant over time yielding an error process that has constant variance.

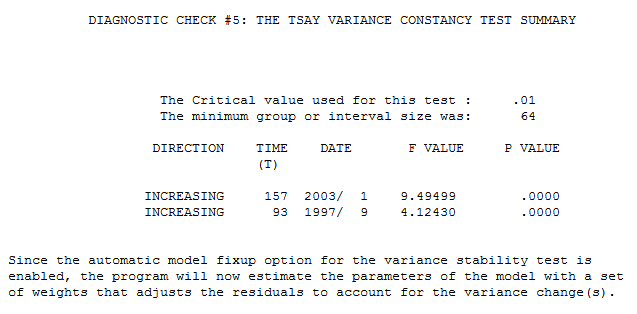
Your 352 values do not qualify for a power transform When (and why) should you take the log of a distribution (of numbers)? because the model error variance does not grow linearly with the expected value BUT does exhibit deterministic error variance change at two points in time enter image description here
See BOX-COX TRANSFORMATION always stabilize variance for a discussion of how to identify the appropriate remedy for non-constant error variance.

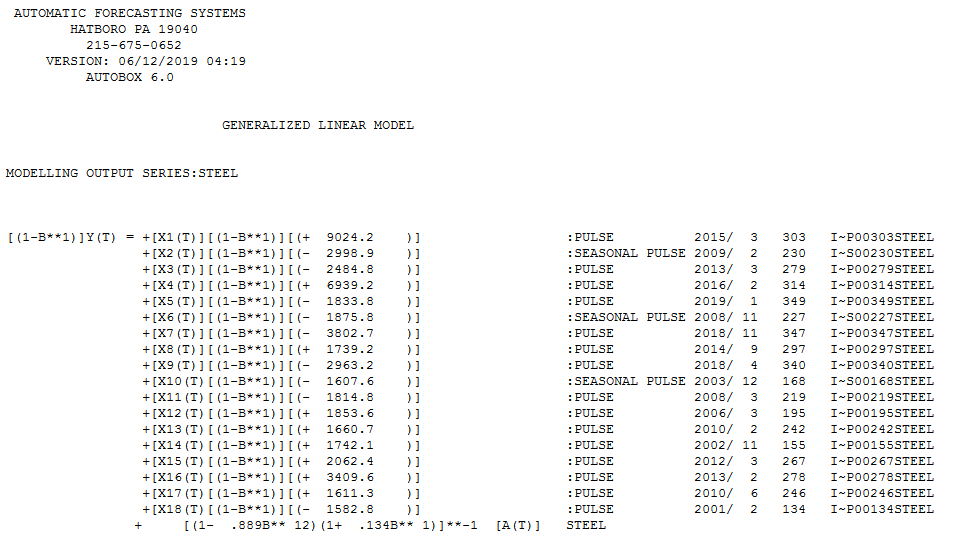
Secondly your series exhibits strong deterministic structure ( pulses ,seasonal pulses ) as listed here in a useful model where February October and December are systematically different

enter image description here

The problem you are having is probably due to auto.arima not dealing well with the presence of the deterministic structure.

you probably just didn't read the fine print or understand the assumptions underlying the statistical test you were employing.

See Interrupted Time Series Analysis - ARIMAX for High Frequency Biological Data? for @AdamO's wise reflection that "The correlogram should be calculated from residuals using a model that controls for intervention administration, otherwise the intervention effects are taken to be Gaussian noise, underestimating the actual autoregressive effect."

In other words for auto.arima to be useful you needed to have the following circumstances.

  1. a series with no pulses,level shifts,seasonal pulses or deterministic time structure like trends et al .

  2. a series where the parameters for the underlying arima model are constant over time

  3. a series where the error variance of the underlying arima model does not change deterministically at different time points.

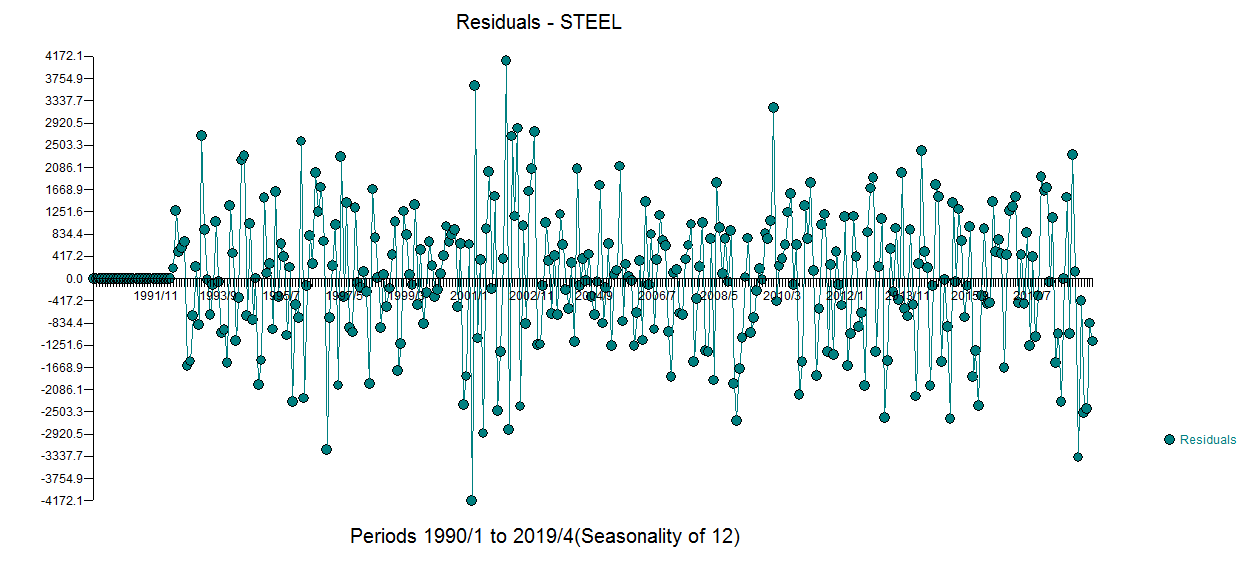
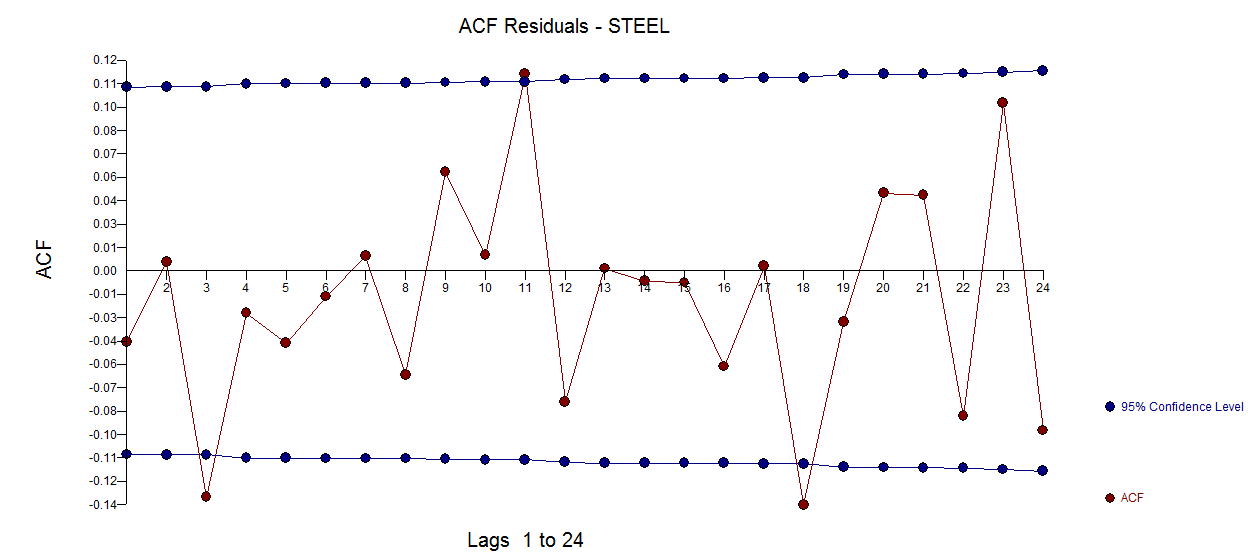
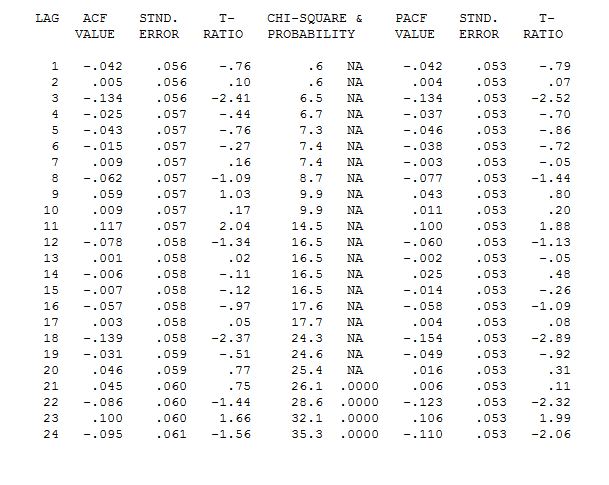
Here is the Actual/Fit and Forecast developed by AUTOBOX enter image description here with the residual plot here enter image description here and acf here enter image description here with decreasing probability values for the Ljung test enter image description here
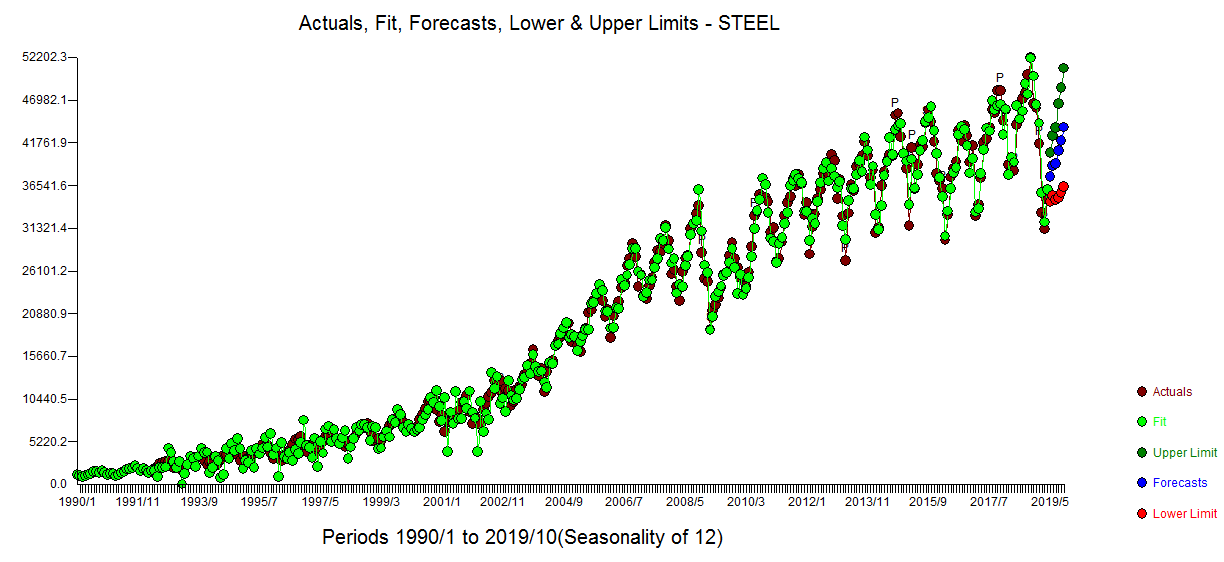
The forecast plot is here enter image description here

Let us review the assumptions that are made when it is safe to visually OR computationally map the sample acf and pacf to a useful arima model. Firstly there must be no deterministic structure latent in your data i.e. no pulses , no step/level shifts , no seasonal pulses and no time trends (often called Deterministic Trends) . Secondly the parameters of the IDENTIFIED (initially and repetitively) arima model must be invariant over time yielding an error process that has constant variance.

Your 352 values do not qualify for a power transform When (and why) should you take the log of a distribution (of numbers)? because the model error variance does not grow linearly with the expected value BUT does exhibit deterministic error variance change at two points in time enter image description here

Secondly your series exhibits strong deterministic structure ( pulses ,seasonal pulses ) as listed here in a useful model where February October and December are systematically different

enter image description here

The problem you are having is probably due to auto.arima not dealing well with the presence of the deterministic structure.

you probably just didn't read the fine print or understand the assumptions underlying the statistical test you were employing.

See Interrupted Time Series Analysis - ARIMAX for High Frequency Biological Data? for @AdamO's wise reflection that "The correlogram should be calculated from residuals using a model that controls for intervention administration, otherwise the intervention effects are taken to be Gaussian noise, underestimating the actual autoregressive effect."

In other words for auto.arima to be useful you needed to have the following circumstances.

  1. a series with no pulses,level shifts,seasonal pulses or deterministic time structure like trends et al .

  2. a series where the parameters for the underlying arima model are constant over time

  3. a series where the error variance of the underlying arima model does not change deterministically at different time points.

Here is the Actual/Fit and Forecast developed by AUTOBOX enter image description here with the residual plot here enter image description here and acf here enter image description here with decreasing probability values for the Ljung test enter image description here

The forecast plot is here enter image description here

Let us review the assumptions that are made when it is safe to visually OR computationally map the sample acf and pacf to a useful arima model. Firstly there must be no deterministic structure latent in your data i.e. no pulses , no step/level shifts , no seasonal pulses and no time trends (often called Deterministic Trends) . Secondly the parameters of the IDENTIFIED (initially and repetitively) arima model must be invariant over time yielding an error process that has constant variance.

Your 352 values do not qualify for a power transform When (and why) should you take the log of a distribution (of numbers)? because the model error variance does not grow linearly with the expected value BUT does exhibit deterministic error variance change at two points in time enter image description here

See BOX-COX TRANSFORMATION always stabilize variance for a discussion of how to identify the appropriate remedy for non-constant error variance.

Secondly your series exhibits strong deterministic structure ( pulses ,seasonal pulses ) as listed here in a useful model where February October and December are systematically different

enter image description here

The problem you are having is probably due to auto.arima not dealing well with the presence of the deterministic structure.

you probably just didn't read the fine print or understand the assumptions underlying the statistical test you were employing.

See Interrupted Time Series Analysis - ARIMAX for High Frequency Biological Data? for @AdamO's wise reflection that "The correlogram should be calculated from residuals using a model that controls for intervention administration, otherwise the intervention effects are taken to be Gaussian noise, underestimating the actual autoregressive effect."

In other words for auto.arima to be useful you needed to have the following circumstances.

  1. a series with no pulses,level shifts,seasonal pulses or deterministic time structure like trends et al .

  2. a series where the parameters for the underlying arima model are constant over time

  3. a series where the error variance of the underlying arima model does not change deterministically at different time points.

Here is the Actual/Fit and Forecast developed by AUTOBOX enter image description here with the residual plot here enter image description here and acf here enter image description here with decreasing probability values for the Ljung test enter image description here
The forecast plot is here enter image description here

Source Link
IrishStat
  • 30k
  • 5
  • 36
  • 60

Let us review the assumptions that are made when it is safe to visually OR computationally map the sample acf and pacf to a useful arima model. Firstly there must be no deterministic structure latent in your data i.e. no pulses , no step/level shifts , no seasonal pulses and no time trends (often called Deterministic Trends) . Secondly the parameters of the IDENTIFIED (initially and repetitively) arima model must be invariant over time yielding an error process that has constant variance.

Your 352 values do not qualify for a power transform When (and why) should you take the log of a distribution (of numbers)? because the model error variance does not grow linearly with the expected value BUT does exhibit deterministic error variance change at two points in time enter image description here

Secondly your series exhibits strong deterministic structure ( pulses ,seasonal pulses ) as listed here in a useful model where February October and December are systematically different

enter image description here

The problem you are having is probably due to auto.arima not dealing well with the presence of the deterministic structure.

you probably just didn't read the fine print or understand the assumptions underlying the statistical test you were employing.

See Interrupted Time Series Analysis - ARIMAX for High Frequency Biological Data? for @AdamO's wise reflection that "The correlogram should be calculated from residuals using a model that controls for intervention administration, otherwise the intervention effects are taken to be Gaussian noise, underestimating the actual autoregressive effect."

In other words for auto.arima to be useful you needed to have the following circumstances.

  1. a series with no pulses,level shifts,seasonal pulses or deterministic time structure like trends et al .

  2. a series where the parameters for the underlying arima model are constant over time

  3. a series where the error variance of the underlying arima model does not change deterministically at different time points.

Here is the Actual/Fit and Forecast developed by AUTOBOX enter image description here with the residual plot here enter image description here and acf here enter image description here with decreasing probability values for the Ljung test enter image description here
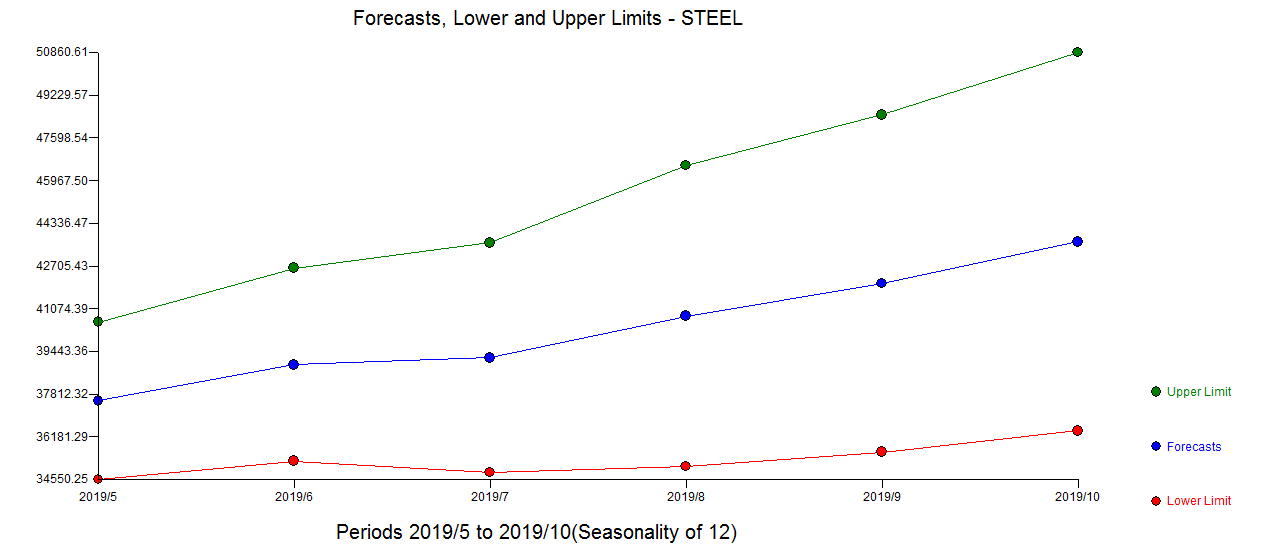
The forecast plot is here enter image description here