Tweeted twitter.com/StackStats/status/1153590713679876097
edited title
Link
NAB
  • 33
  • 4

Picking random regression lines within confidence bandsfrom the distribution of an OLS regressionregressions

added 435 characters in body
Source Link
NAB
  • 33
  • 4

I regressed a series of data with OLS, and I calculated the standard error (SE) of the slope and of the intercept. Moreover, I calculated the confidence bands for the regression following the equations in the answer to this question.

  Now I am wondering how I can generate a set of random regression lines within this distribution of regression lines. Clearly, I cannot just pick random values of the slope and intercept values from a normal distribution defined by mean and SE, because slope and intercept are not independent. As expected, when I do this, I pick a bunch of lines that lie outsideis illustrated by the 95% confidence interval. Is there a simple way to generate regressions that are representative of the true distribution of regression lines (i.e. "combined" slope and intercept values)?

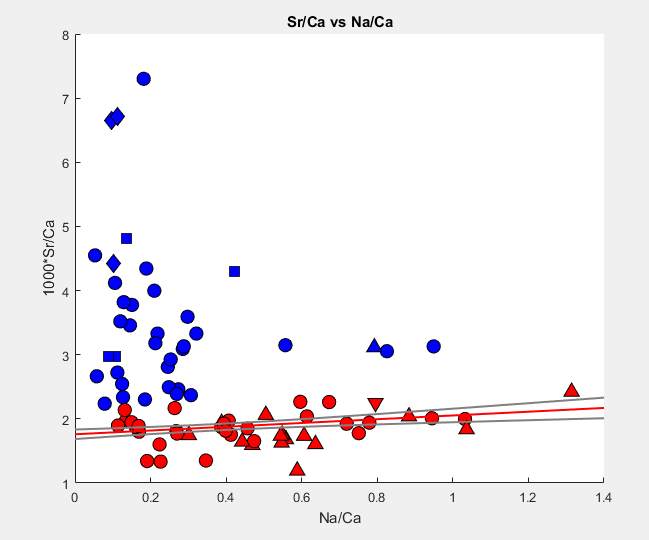
The details of whyIn order to illustrate what I need this are probably irrelevantmean, but in casehere is a short summary of interest,my problem. I have a series of data (dataset A; blue points in below figure) that deviate from a linear trend defined by another dataset (dataset B; red points in below figure). Using some constraints from chemistry, I can correct A by projecting each point onto the linear trend defined by B (red regression line in below figure). In order to propagateconsider the uncertainty fromin the regression of dataset B in the corrected values for dataset A, I was thinking of picking lines at random from the distribution of regressions of dataset B, and repeating the projection forprojecting A onto each of thethese lines. I just do not know how to pick lines that are representative of the distribution of regressions.

enter image description here

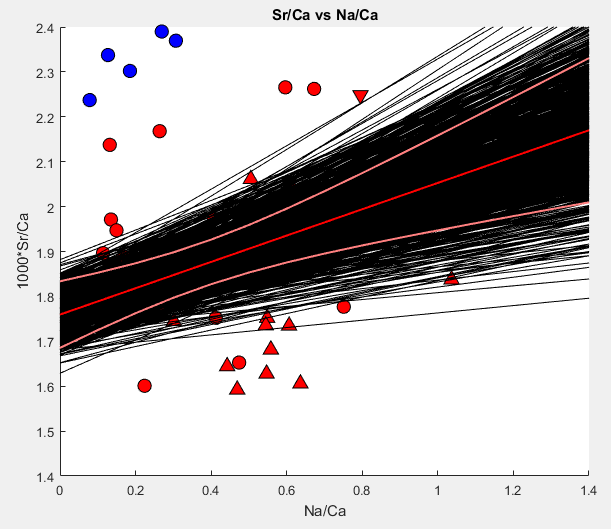
Below is now a zoom into the same plot as above. Now, the black lines show 100 regression lines picked at random. These lines were generated by choosing random values for the slope and intercept from normal distributions with mean and standard errors obtained from the regression. enter image description here
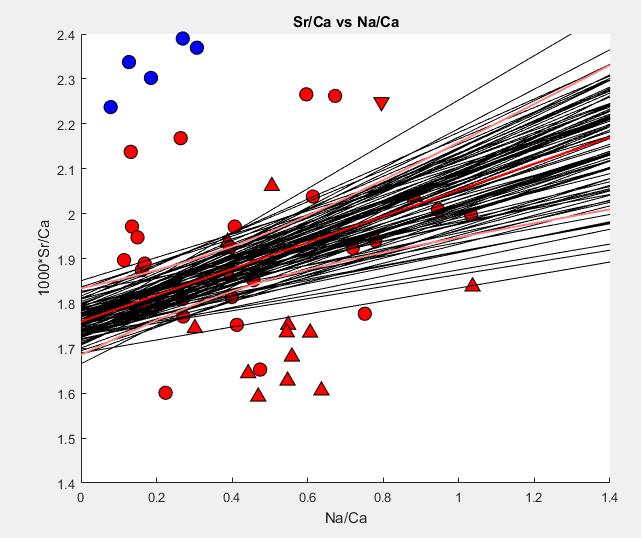
Here is the same with 1000 lines enter image description here

There seem to be more than 5% of the lines that fall out of the 95% confidence bands, and the method of picking a random slope and a random intercept value does not work. This makes sense, considering that slope and intercept are not independent. Is there a simple way to generate regressions that are representative of the true distribution of regression lines around the "best fit"?

Thanks and please let me know if any of this is unclear

I regressed a series of data with OLS, and I calculated the standard error (SE) of the slope and of the intercept. Moreover, I calculated the confidence bands for the regression following the equations in the answer to this question.

  Now I am wondering how I can generate a set of random regression lines within this distribution of regression lines. Clearly, I cannot just pick random values of the slope and intercept values from a normal distribution defined by mean and SE, because slope and intercept are not independent. As expected, when I do this, I pick a bunch of lines that lie outside the 95% confidence interval. Is there a simple way to generate regressions that are representative of the true distribution of regression lines (i.e. "combined" slope and intercept values)?

The details of why I need this are probably irrelevant, but in case of interest, I have a series of data (dataset A; blue points in below figure) that deviate from a linear trend defined by another dataset (dataset B; red points in below figure). Using some constraints from chemistry, I can correct A by projecting each point onto the linear trend defined by B (red regression line in below figure). In order to propagate the uncertainty from the regression of dataset B, I was thinking of picking lines at random from the distribution of regressions of dataset B, and repeating the projection for each of the lines. I just do not know how to pick lines that are representative of the distribution of regressions.

enter image description here

Thanks and please let me know if any of this is unclear

I regressed a series of data with OLS, and I calculated the standard error (SE) of the slope and of the intercept. Moreover, I calculated the confidence bands for the regression following the equations in the answer to this question. Now I am wondering how I can generate a set of random regression lines within this distribution of regression lines that is illustrated by the 95% confidence interval.

In order to illustrate what I mean, here is a short summary of my problem. I have a series of data (dataset A; blue points in below figure) that deviate from a linear trend defined by another dataset (dataset B; red points in below figure). Using some constraints from chemistry, I can correct A by projecting each point onto the linear trend defined by B (red regression line in below figure). In order to consider the uncertainty in the regression of dataset B in the corrected values for dataset A, I was thinking of picking lines at random from the distribution of regressions of dataset B, and projecting A onto each of these lines. I just do not know how to pick lines that are representative of the distribution of regressions.

enter image description here

Below is now a zoom into the same plot as above. Now, the black lines show 100 regression lines picked at random. These lines were generated by choosing random values for the slope and intercept from normal distributions with mean and standard errors obtained from the regression. enter image description here

Here is the same with 1000 lines enter image description here

There seem to be more than 5% of the lines that fall out of the 95% confidence bands, and the method of picking a random slope and a random intercept value does not work. This makes sense, considering that slope and intercept are not independent. Is there a simple way to generate regressions that are representative of the true distribution of regression lines around the "best fit"?

Thanks and please let me know if any of this is unclear
deleted 359 characters in body
Source Link
NAB
  • 33
  • 4

I regressed a series of data with OLS, and I calculated the standard error (SE) of the slope and of the intercept. Moreover, I calculated the confidence bands for the regression following the equations in the answer to this question.

Now I am wondering how I can generate a set of random regression lines within this distribution of regression lines. Clearly, I cannot just pick random values of the slope and intercept values from a normal distribution defined by mean and SE, because slope and intercept are not independent. As expected, when I do this, I pick a bunch of lines that lie outside the 95% confidence interval. Is there a simple way to generate regressions that are representative of the true distribution of regression lines (i.e. "combined" slope and intercept values)?

The details of why I need this are probably irrelevant, but in case of interest, I have a series of data (dataset AA; blue points in below figure) that deviate from a linear trend defined by another dataset (dataset BB; red points in below figure). Using some constraints from chemistry, I can correct A by projecting each point onto the linear trend defined by B (red regression line in below figure). In order to estimatepropagate the uncertainty infrom the correctionregression of dataset AB, I was thinking of picking lines at random from the distribution of regressions of dataset B, and repeatrepeating the projection for each of the lines.

Below is an example for such a problem. In this figure, the red datapoints (and the black regression line) define an "ideal" linear trend. The white and black data points deviate from that line, but I can use some chemistry to project them back onto the line. In this example, the regression through the red datapoints is quite well define, but if it is not, there is interest in propagating the uncertainty in the regression through the analysis. One option is to use Monte Carlo to pick a number of regression lines, and see how the projected values vary. But Ijust do not know how to pick lines that are representative of the setdistribution of regression linesregressions.

enter image description here

Thanks and please let me know if any of this is unclear

I regressed a series of data with OLS, and I calculated the standard error (SE) of the slope and of the intercept. Moreover, I calculated the confidence bands for the regression following the equations in the answer to this question.

Now I am wondering how I can generate a set of random regression lines within this distribution of regression lines. Clearly, I cannot just pick random values of the slope and intercept values from a normal distribution defined by mean and SE, because slope and intercept are not independent. As expected, when I do this, I pick a bunch of lines that lie outside the 95% confidence interval. Is there a simple way to generate regressions that are representative of the true distribution of regression lines (i.e. "combined" slope and intercept values)?

The details of why I need this are probably irrelevant, but in case of interest, I have a series of data (dataset A) that deviate from a linear trend defined by another dataset (dataset B). I can correct A by projecting each point onto the linear trend defined by B. In order to estimate the uncertainty in the correction of dataset A, I was thinking of picking lines at random from the distribution of regressions of dataset B, and repeat the projection for each of the lines.

Below is an example for such a problem. In this figure, the red datapoints (and the black regression line) define an "ideal" linear trend. The white and black data points deviate from that line, but I can use some chemistry to project them back onto the line. In this example, the regression through the red datapoints is quite well define, but if it is not, there is interest in propagating the uncertainty in the regression through the analysis. One option is to use Monte Carlo to pick a number of regression lines, and see how the projected values vary. But I do not know how to pick the set of regression lines.

Thanks and please let me know if any of this is unclear

I regressed a series of data with OLS, and I calculated the standard error (SE) of the slope and of the intercept. Moreover, I calculated the confidence bands for the regression following the equations in the answer to this question.

Now I am wondering how I can generate a set of random regression lines within this distribution of regression lines. Clearly, I cannot just pick random values of the slope and intercept values from a normal distribution defined by mean and SE, because slope and intercept are not independent. As expected, when I do this, I pick a bunch of lines that lie outside the 95% confidence interval. Is there a simple way to generate regressions that are representative of the true distribution of regression lines (i.e. "combined" slope and intercept values)?

The details of why I need this are probably irrelevant, but in case of interest, I have a series of data (dataset A; blue points in below figure) that deviate from a linear trend defined by another dataset (dataset B; red points in below figure). Using some constraints from chemistry, I can correct A by projecting each point onto the linear trend defined by B (red regression line in below figure). In order to propagate the uncertainty from the regression of dataset B, I was thinking of picking lines at random from the distribution of regressions of dataset B, and repeating the projection for each of the lines. I just do not know how to pick lines that are representative of the distribution of regressions.

enter image description here

Thanks and please let me know if any of this is unclear

added 565 characters in body
Source Link
NAB
  • 33
  • 4
Loading
added 34 characters in body
Source Link
NAB
  • 33
  • 4
Loading
Source Link
NAB
  • 33
  • 4
Loading