added 3 characters in body
Source Link
BruceET
  • 57.6k
  • 2
  • 36
  • 94

Some distributions are inherently right-skewed, and almost all samples from them have boxplot outliers. In some cases, repeated 'capping' seemscan seem to be never-ending.

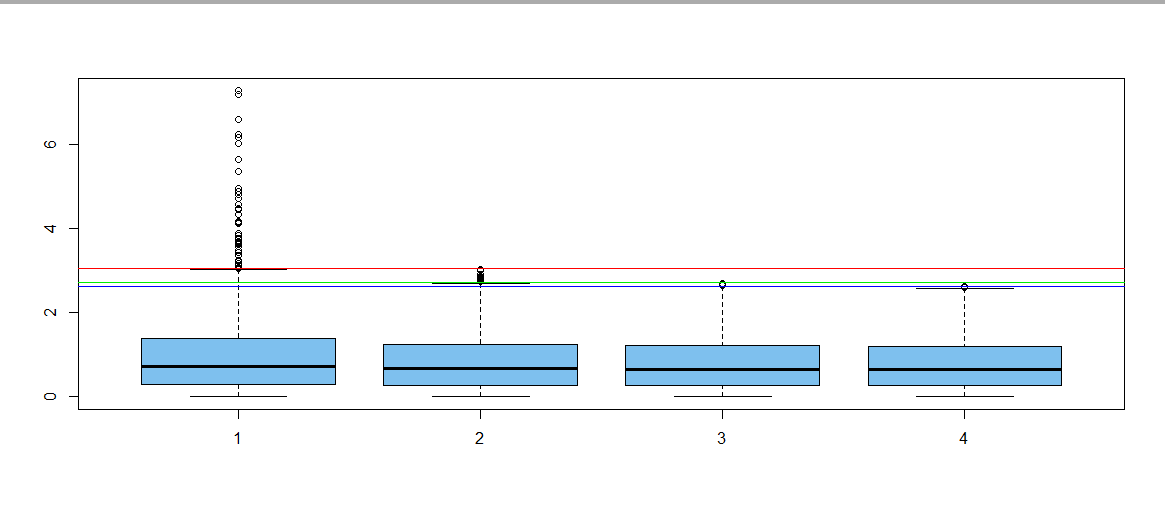
In the following example, a simulated sample in R of size $n=1000$ from a standard exponential distribution (mean and rate both 1) gets capped three times, using the upper 'fence' of the boxplot outlier rule as the criterion. And there is still more capping to be done.

set.seed(1234); n = 1000
x1 = rexp(n)
 cap1 = quantile(x1,.75)+1.5*IQR(x1)
x2 = x1[x1 <= cap1]
 cap2 = quantile(x2,.75)+1.5*IQR(x2)
x3 = x2[x2 <= cap2]
 cap3 = quantile(x3,.75)+1.5*IQR(x3)
x4 = x3[x3 <= cap3]
boxplot(x1, x2, x3, x4, col="skyblue2")
 abline(h = c(cap1,cap2,cap3), col=c("red","green2","blue"))

enter image description here

You have to be clear about your reason for capping. If you have a good reason, maybe you have a good 'cap' to go with it. Then you could cap just once, based on a reasonable standard---not based on what data you happen to get.

In my exponential example above, about 95% of the population has values of 3 or below. Maybe just choose 3 as the cap.

Addendum: Almost all exponential samples of size only $n=100$ have at least one outlier and the average number of outliers among such samples is more than 4.8.

set.seed(2019)
nr.out = replicate(10^6, 
           length(boxplot.stats(rexp(100))$out))
mean(nr.out); mean(nr.out > 0)
[1] 4.850963
[1] 0.990244
round(table(nr.out)/10^6, 4)
nr.out
     0      1      2      3      4      5      6      7      8      9 
0.0098 0.0423 0.0954 0.1470 0.1744 0.1687 0.1388 0.0985 0.0619 0.0340 
    10     11     12     13     14     15     16     17     18 
0.0170 0.0077 0.0030 0.0011 0.0004 0.0001 0.0000 0.0000 0.0000 

The distribution of the number of outliers per sample of 100 is roughly Poisson with mean 4.85.

Some distributions are inherently right-skewed, and almost all samples from them have boxplot outliers. In some cases, repeated 'capping' seems to be never-ending.

In the following example, a simulated sample in R of size $n=1000$ from a standard exponential distribution (mean and rate both 1) gets capped three times, using the upper 'fence' of the boxplot outlier rule as the criterion. And there is still more capping to be done.

set.seed(1234); n = 1000
x1 = rexp(n)
 cap1 = quantile(x1,.75)+1.5*IQR(x1)
x2 = x1[x1 <= cap1]
 cap2 = quantile(x2,.75)+1.5*IQR(x2)
x3 = x2[x2 <= cap2]
 cap3 = quantile(x3,.75)+1.5*IQR(x3)
x4 = x3[x3 <= cap3]
boxplot(x1, x2, x3, x4, col="skyblue2")
 abline(h = c(cap1,cap2,cap3), col=c("red","green2","blue"))

enter image description here

You have to be clear about your reason for capping. If you have a good reason, maybe you have a good 'cap' to go with it. Then you could cap just once, based on a reasonable standard---not based on what data you happen to get.

In my exponential example above, about 95% of the population has values of 3 or below. Maybe just choose 3 as the cap.

Addendum: Almost all exponential samples of size only $n=100$ have at least one outlier and the average number of outliers among such samples is more than 4.8.

set.seed(2019)
nr.out = replicate(10^6, 
           length(boxplot.stats(rexp(100))$out))
mean(nr.out); mean(nr.out > 0)
[1] 4.850963
[1] 0.990244
round(table(nr.out)/10^6, 4)
nr.out
     0      1      2      3      4      5      6      7      8      9 
0.0098 0.0423 0.0954 0.1470 0.1744 0.1687 0.1388 0.0985 0.0619 0.0340 
    10     11     12     13     14     15     16     17     18 
0.0170 0.0077 0.0030 0.0011 0.0004 0.0001 0.0000 0.0000 0.0000 

The distribution of the number of outliers per sample of 100 is roughly Poisson with mean 4.85.
Some distributions are inherently right-skewed, and almost all samples from them have boxplot outliers. In some cases, repeated 'capping' can seem to be never-ending.

In the following example, a simulated sample in R of size $n=1000$ from a standard exponential distribution (mean and rate both 1) gets capped three times, using the upper 'fence' of the boxplot outlier rule as the criterion. And there is still more capping to be done.

set.seed(1234); n = 1000
x1 = rexp(n)
 cap1 = quantile(x1,.75)+1.5*IQR(x1)
x2 = x1[x1 <= cap1]
 cap2 = quantile(x2,.75)+1.5*IQR(x2)
x3 = x2[x2 <= cap2]
 cap3 = quantile(x3,.75)+1.5*IQR(x3)
x4 = x3[x3 <= cap3]
boxplot(x1, x2, x3, x4, col="skyblue2")
 abline(h = c(cap1,cap2,cap3), col=c("red","green2","blue"))

enter image description here

You have to be clear about your reason for capping. If you have a good reason, maybe you have a good 'cap' to go with it. Then you could cap just once, based on a reasonable standard---not based on what data you happen to get.

In my exponential example above, about 95% of the population has values of 3 or below. Maybe just choose 3 as the cap.

Addendum: Almost all exponential samples of size only $n=100$ have at least one outlier and the average number of outliers among such samples is more than 4.8.

set.seed(2019)
nr.out = replicate(10^6, 
           length(boxplot.stats(rexp(100))$out))
mean(nr.out); mean(nr.out > 0)
[1] 4.850963
[1] 0.990244
round(table(nr.out)/10^6, 4)
nr.out
     0      1      2      3      4      5      6      7      8      9 
0.0098 0.0423 0.0954 0.1470 0.1744 0.1687 0.1388 0.0985 0.0619 0.0340 
    10     11     12     13     14     15     16     17     18 
0.0170 0.0077 0.0030 0.0011 0.0004 0.0001 0.0000 0.0000 0.0000 

The distribution of the number of outliers per sample of 100 is roughly Poisson with mean 4.85.

added 669 characters in body
Source Link
BruceET
  • 57.6k
  • 2
  • 36
  • 94

You have to be clear about your reason for capping. If you have a good reason, maybe you have a good 'cap' to go with it. Then you could cap just once, based on a reasonable standard---not based on what data you happen to get.

In my exponential example above, about 95% of the population has values of 3 or below. Maybe just choose 3 as the cap.

Addendum: Almost all exponential samplesamples of size only $n=100$ have at least one outlier and the average number of outliers among such samples is more than 4.8.

You have to be clear about your reason for capping. If you have a good reason, maybe you have a good 'cap' to go with it. Then you could cap just once, based on a reasonable standard---not based on what data you happen to get.

In my exponential example above, about 95%The distribution of the population has values of 3 or belownumber of outliers per sample of 100 is roughly Poisson with mean 4. Maybe just choose 3 as the cap85.

Almost all exponential sample of size only $n=100$ have at least one outlier and the average number of outliers among such samples is more than 4.8.

You have to be clear about your reason for capping. If you have a good reason, maybe you have a good 'cap' to go with it. Then you could cap just once, based on a reasonable standard---not based on what data you happen to get.

In my exponential example above, about 95% of the population has values of 3 or below. Maybe just choose 3 as the cap.

Addendum: Almost all exponential samples of size only $n=100$ have at least one outlier and the average number of outliers among such samples is more than 4.8.

The distribution of the number of outliers per sample of 100 is roughly Poisson with mean 4.85.

added 669 characters in body
Source Link
BruceET
  • 57.6k
  • 2
  • 36
  • 94

Some distributions are inherently right-skewed, and almost all samples from them have boxplot outliers. In some cases, repeated 'capping' seems to be never-ending.

In the following example, a simulated sample in R of size $n=1000$ from a standard exponential distribution (mean and rate both 1) gets capped three times, using the upper 'fence' of the boxplot outlier rule as the criterion. And there is still more capping to be done.

set.seed(1234); n = 1000
x1 = rexp(n)
 cap1 = quantile(x1,.75)+1.5*IQR(x1)
x2 = x1[x1 <= cap1]
 cap2 = quantile(x2,.75)+1.5*IQR(x2)
x3 = x2[x2 <= cap2]
 cap3 = quantile(x3,.75)+1.5*IQR(x3)
x4 = x3[x3 <= cap3]
boxplot(x1, x2, x3, x4, col="skyblue2")
 abline(h = c(cap1,cap2,cap3), col=c("red","green2","blue"))

enter image description here

Almost all exponential sample of size only $n=100$ have at least one outlier and the average number of outliers among such samples is more than 4.8.

set.seed(2019)
nr.out = replicate(10^6, 
           length(boxplot.stats(rexp(100))$out))
mean(nr.out); mean(nr.out > 0)
[1] 4.850963
[1] 0.990244
round(table(nr.out)/10^6, 4)
nr.out
     0      1      2      3      4      5      6      7      8      9 
0.0098 0.0423 0.0954 0.1470 0.1744 0.1687 0.1388 0.0985 0.0619 0.0340 
    10     11     12     13     14     15     16     17     18 
0.0170 0.0077 0.0030 0.0011 0.0004 0.0001 0.0000 0.0000 0.0000 

You have to be clear about your reason for capping. If you have a good reason, maybe you have a good 'cap' to go with it. Then you could cap just once, based on a reasonable standard---not based on what data you happen to get.

In my exponential example above, about 95% of the population has values of 3 or below. Maybe just choose 3 as the cap.

Some distributions are inherently right-skewed, and almost all samples from them have boxplot outliers. In some cases, repeated 'capping' seems to be never-ending.

In the following example, a simulated sample in R of size $n=1000$ from a standard exponential distribution (mean and rate both 1) gets capped three times, using the upper 'fence' of the boxplot outlier rule as the criterion. And there is still more capping to be done.

set.seed(1234); n = 1000
x1 = rexp(n)
 cap1 = quantile(x1,.75)+1.5*IQR(x1)
x2 = x1[x1 <= cap1]
 cap2 = quantile(x2,.75)+1.5*IQR(x2)
x3 = x2[x2 <= cap2]
 cap3 = quantile(x3,.75)+1.5*IQR(x3)
x4 = x3[x3 <= cap3]
boxplot(x1, x2, x3, x4, col="skyblue2")
 abline(h = c(cap1,cap2,cap3), col=c("red","green2","blue"))

enter image description here

Almost all exponential sample of size only $n=100$ have at least one outlier and the average number of outliers among such samples is more than 4.8.

set.seed(2019)
nr.out = replicate(10^6, 
           length(boxplot.stats(rexp(100))$out))
mean(nr.out); mean(nr.out > 0)
[1] 4.850963
[1] 0.990244
round(table(nr.out)/10^6, 4)
nr.out
     0      1      2      3      4      5      6      7      8      9 
0.0098 0.0423 0.0954 0.1470 0.1744 0.1687 0.1388 0.0985 0.0619 0.0340 
    10     11     12     13     14     15     16     17     18 
0.0170 0.0077 0.0030 0.0011 0.0004 0.0001 0.0000 0.0000 0.0000 

You have to be clear about your reason for capping. If you have a good reason, maybe you have a good 'cap' to go with it. Then you could cap just once, based on a reasonable standard---not based on what data you happen to get.

In my exponential example above, about 95% of the population has values of 3 or below. Maybe just choose 3 as the cap.

deleted 1 character in body
Source Link
BruceET
  • 57.6k
  • 2
  • 36
  • 94
Loading
Source Link
BruceET
  • 57.6k
  • 2
  • 36
  • 94
Loading