added 4 characters in body
Source Link
BruceET
  • 57.6k
  • 2
  • 36
  • 94

Comment. A surprisingly broad question.

This page shows simulation results for correlations of two independent standard uniform distributions. Results seem to differ greatly for various (especially small) numbers $n$ of pairs of points. Each histogram represents $100,000$ values of $r.$

enter image description here

For normal data, of course, there is Fisher's work on the distribution of $r.$ (See Wikipedia.)

When you say 'average correlation', do you mean $E(r)$ or $E(|r|)?$ When you say 'maximum correlation', what sample sizes do you have in mind to keep the maximum below 1? To start: I hope you can specify a few cases of greatest interest (dimensions, sample sizes, uniform vs. normal vs. what other distributions?).

Addendum per @whuber's Comment: Further experimentation. Five observations on each of five independent uniform variables.

set.seed(906)
n = 5;  m = 5;  u = runif(n*m)
DTA = matrix(u, nrow=m)
cor(DTA)
           [,1]       [,2]       [,3]        [,4]        [,5]
[1,]  1.0000000  0.1957409 -0.8233160 -0.39093048 -0.62212314
[2,]  0.1957409  1.0000000 -0.1255770  0.62306226 -0.61205725
[3,] -0.8233160 -0.1255770  1.0000000  0.36625813  0.22424637
[4,] -0.3909305  0.6230623  0.3662581  1.00000000  0.08519501
[5,] -0.6221231 -0.6120572  0.2242464  0.08519501  1.00000000
max(abs(cor(DTA)-diag(5)))
[1] 0.823316

Highest absolute correlation happens to be about $|r| \approx 0.82,$ between variables 1 and 3. Matrix plot shows all ${5 \choose 2}$ pairs---see center top row. (AbsoluteMax absolute correlations this high are not rare. Tried several runs before this one with set.seed to post.)

pairs(DTA)

enter image description here

Comment. A surprisingly broad question.

This page shows simulation results for correlations of two independent standard uniform distributions. Results seem to differ greatly for various (especially small) numbers $n$ of pairs of points. Each histogram represents $100,000$ values of $r.$

enter image description here

For normal data, of course, there is Fisher's work on the distribution of $r.$ (See Wikipedia.)

When you say 'average correlation', do you mean $E(r)$ or $E(|r|)?$ When you say 'maximum correlation', what sample sizes do you have in mind to keep the maximum below 1? To start: I hope you can specify a few cases of greatest interest (dimensions, sample sizes, uniform vs. normal vs. what other distributions?).

Addendum per @whuber's Comment: Further experimentation. Five observations on each of five independent uniform variables.

set.seed(906)
n = 5;  m = 5;  u = runif(n*m)
DTA = matrix(u, nrow=m)
cor(DTA)
           [,1]       [,2]       [,3]        [,4]        [,5]
[1,]  1.0000000  0.1957409 -0.8233160 -0.39093048 -0.62212314
[2,]  0.1957409  1.0000000 -0.1255770  0.62306226 -0.61205725
[3,] -0.8233160 -0.1255770  1.0000000  0.36625813  0.22424637
[4,] -0.3909305  0.6230623  0.3662581  1.00000000  0.08519501
[5,] -0.6221231 -0.6120572  0.2242464  0.08519501  1.00000000
max(abs(cor(DTA)-diag(5)))
[1] 0.823316

Highest absolute correlation happens to be about $|r| \approx 0.82,$ between variables 1 and 3. Matrix plot shows all ${5 \choose 2}$ pairs---see center top row. (Absolute correlations this high are not rare. Tried several runs before this one with set.seed to post.)

pairs(DTA)
enter image description here

Comment. A surprisingly broad question.

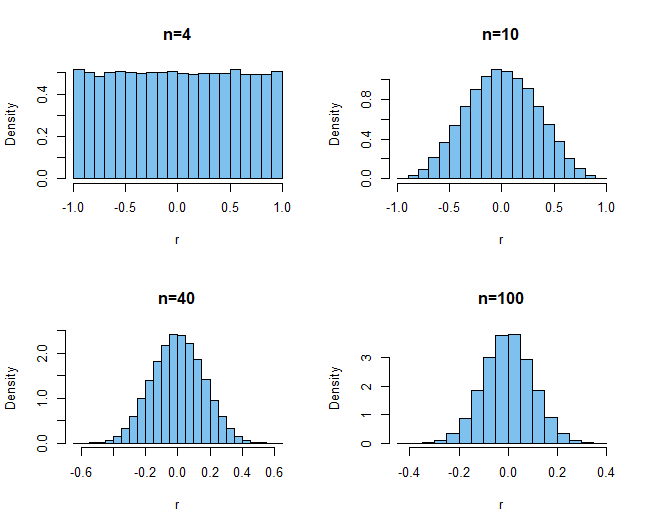
This page shows simulation results for correlations of two independent standard uniform distributions. Results seem to differ greatly for various (especially small) numbers $n$ of pairs of points. Each histogram represents $100,000$ values of $r.$

enter image description here

For normal data, of course, there is Fisher's work on the distribution of $r.$ (See Wikipedia.)

When you say 'average correlation', do you mean $E(r)$ or $E(|r|)?$ When you say 'maximum correlation', what sample sizes do you have in mind to keep the maximum below 1? To start: I hope you can specify a few cases of greatest interest (dimensions, sample sizes, uniform vs. normal vs. what other distributions?).

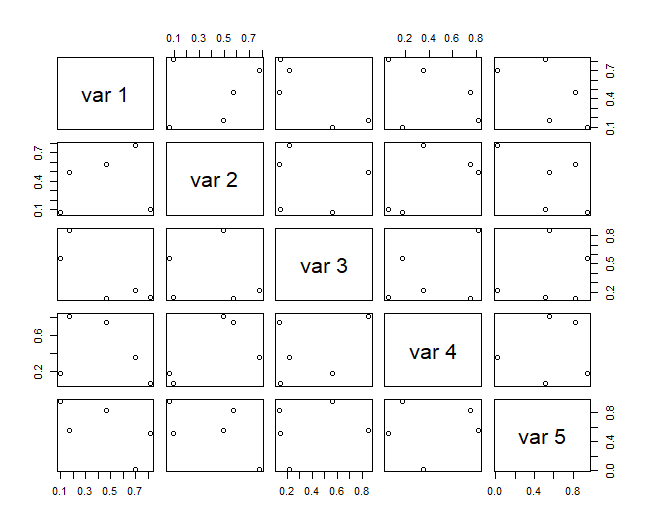
Addendum per @whuber's Comment: Further experimentation. Five observations on each of five independent uniform variables.

set.seed(906)
n = 5;  m = 5;  u = runif(n*m)
DTA = matrix(u, nrow=m)
cor(DTA)
           [,1]       [,2]       [,3]        [,4]        [,5]
[1,]  1.0000000  0.1957409 -0.8233160 -0.39093048 -0.62212314
[2,]  0.1957409  1.0000000 -0.1255770  0.62306226 -0.61205725
[3,] -0.8233160 -0.1255770  1.0000000  0.36625813  0.22424637
[4,] -0.3909305  0.6230623  0.3662581  1.00000000  0.08519501
[5,] -0.6221231 -0.6120572  0.2242464  0.08519501  1.00000000
max(abs(cor(DTA)-diag(5)))
[1] 0.823316

Highest absolute correlation happens to be about $|r| \approx 0.82,$ between variables 1 and 3. Matrix plot shows all ${5 \choose 2}$ pairs---see center top row. (Max absolute correlations this high are not rare. Tried several runs before this one with set.seed to post.)

pairs(DTA)
enter image description here

added 1057 characters in body
Source Link
BruceET
  • 57.6k
  • 2
  • 36
  • 94

Comment. A surprisingly broad question.

This page shows simulation results for correlations of two independent standard uniform distributions. Results seem to differ greatly for various (especially small) numbers $n$ of pairs of points. Each histogram represents $100,000$ values of $r.$

enter image description here

For normal data, of course, there is Fisher's work on the distribution of $r.$ (See Wikipedia.)

When you say 'average correlation', do you mean $E(r)$ or $E(|r|)?$ When you say 'maximum correlation', what sample sizes do you have in mind to keep the maximum below 1? To start: I hope you can specify a few cases of greatest interest (dimensions, sample sizes, uniform vs. normal vs. what other distributions?).

Addendum per @whuber's Comment: Further experimentation. Five observations on each of five independent uniform variables.

set.seed(906)
n = 5;  m = 5;  u = runif(n*m)
DTA = matrix(u, nrow=m)
cor(DTA)
           [,1]       [,2]       [,3]        [,4]        [,5]
[1,]  1.0000000  0.1957409 -0.8233160 -0.39093048 -0.62212314
[2,]  0.1957409  1.0000000 -0.1255770  0.62306226 -0.61205725
[3,] -0.8233160 -0.1255770  1.0000000  0.36625813  0.22424637
[4,] -0.3909305  0.6230623  0.3662581  1.00000000  0.08519501
[5,] -0.6221231 -0.6120572  0.2242464  0.08519501  1.00000000
max(abs(cor(DTA)-diag(5)))
[1] 0.823316

Highest absolute correlation happens to be about $|r| \approx 0.82,$ between variables 1 and 3. Matrix plot shows all ${5 \choose 2}$ pairs---see center top row. (Absolute correlations this high are not rare. Tried several runs before this one with set.seed to post.)

pairs(DTA)

enter image description here

Comment. A surprisingly broad question.

This page shows simulation results for correlations of two independent standard uniform distributions. Results seem to differ greatly for various (especially small) numbers $n$ of pairs of points. Each histogram represents $100,000$ values of $r.$

enter image description here

For normal data, of course, there is Fisher's work on the distribution of $r.$ (See Wikipedia.)

When you say 'average correlation', do you mean $E(r)$ or $E(|r|)?$ When you say 'maximum correlation', what sample sizes do you have in mind to keep the maximum below 1? To start: I hope you can specify a few cases of greatest interest (dimensions, sample sizes, uniform vs. normal vs. what other distributions?).

Addendum per @whuber's Comment: Further experimentation. Five observations on each of five independent uniform variables.

set.seed(906)
n = 5;  m = 5;  u = runif(n*m)
DTA = matrix(u, nrow=m)
cor(DTA)
           [,1]       [,2]       [,3]        [,4]        [,5]
[1,]  1.0000000  0.1957409 -0.8233160 -0.39093048 -0.62212314
[2,]  0.1957409  1.0000000 -0.1255770  0.62306226 -0.61205725
[3,] -0.8233160 -0.1255770  1.0000000  0.36625813  0.22424637
[4,] -0.3909305  0.6230623  0.3662581  1.00000000  0.08519501
[5,] -0.6221231 -0.6120572  0.2242464  0.08519501  1.00000000
max(abs(cor(DTA)-diag(5)))
[1] 0.823316

Highest absolute correlation happens to be about $|r| \approx 0.82,$ between variables 1 and 3. Matrix plot shows all ${5 \choose 2}$ pairs---see center top row. (Absolute correlations this high are not rare. Tried several runs before this one with set.seed to post.)

pairs(DTA)

enter image description here

added 9 characters in body
Source Link
BruceET
  • 57.6k
  • 2
  • 36
  • 94

Comment. A surprisingly broad question.

This page shows simulation results for correlations of two independent standard uniform distributions. Results seem to differ greatly for various (especially small) numbers $n$ of pairs of points. Each histogram represents $100,000$ values of $r.$

enter image description here

For normal data, of course, there is Fisher's work on the distribution of $r.$ (See Wikipedia.)

When you say 'average correlation', do you mean $E(r)$ or $E(|r|)?$ When you say 'maximum correlation', what sample sizes do you have in mind to keep the maximum below 1? To start: I hope you can specify a few cases of greatest interest (dimensions, sample sizes, uniform vs. normal vs. what other distributions?).

Comment. A surprisingly broad question.

This page shows simulation results for correlations of two independent standard uniform distributions. Results seem to differ greatly for various (especially small) numbers $n$ of pairs of points. Each histogram represents $100,000$ values of $r.$

enter image description here

For normal data, of course, there is Fisher's work on the distribution of $r.$ (See Wikipedia.)

When you say 'average correlation', do you mean $E(r)$ or $E(|r|)?$ When you say 'maximum correlation', what sample sizes do you have in mind to keep the maximum below 1? To start: I hope you can specify a few cases of greatest interest (dimensions, sample sizes, uniform vs. normal).

Comment. A surprisingly broad question.

This page shows simulation results for correlations of two independent standard uniform distributions. Results seem to differ greatly for various (especially small) numbers $n$ of pairs of points. Each histogram represents $100,000$ values of $r.$

enter image description here

For normal data, of course, there is Fisher's work on the distribution of $r.$ (See Wikipedia.)

When you say 'average correlation', do you mean $E(r)$ or $E(|r|)?$ When you say 'maximum correlation', what sample sizes do you have in mind to keep the maximum below 1? To start: I hope you can specify a few cases of greatest interest (dimensions, sample sizes, uniform vs. normal vs. what other distributions?).

added 9 characters in body
Source Link
BruceET
  • 57.6k
  • 2
  • 36
  • 94
Loading
Source Link
BruceET
  • 57.6k
  • 2
  • 36
  • 94
Loading