edited tags
Link
Danica
  • 25.2k
  • 2
  • 76
  • 140
I updated my post with model and chart.
Source Link
user1471980
  • 745
  • 3
  • 11
  • 21

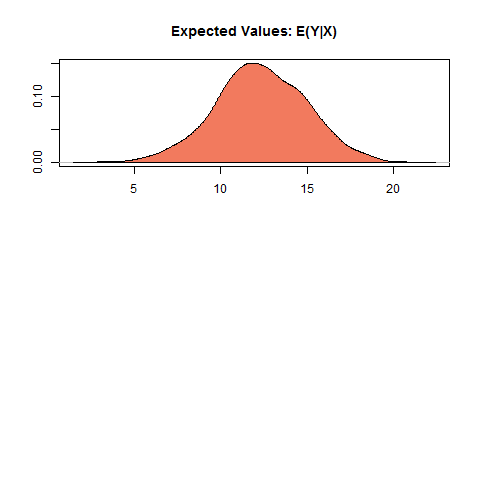
I'm running simulation on a linear model. I get 1000 results and the results are put into a density chart. I do understand that the xaxis is the dependent variable and yaxis represent the kernel density. Yaxis is in decimal numbers like from 0 to 0.15 . How do I explain this to the other users? There is a 15% chance that the simulated values will fall between x1 and x2?

This is my simulation output:

summary(s)

Model:  ls 
Number of simulations:  1000 

Values of X
  (Intercept)  Volume
1           1 1699992
attr(,"assign")
[1] 0 1

Expected Values: E(Y|X) 
    mean    sd    50% 2.5%  97.5%
1 12.305 2.638 12.231 7.03 17.512
enter image description here

I'm running simulation on a linear model. I get 1000 results and the results are put into a density chart. I do understand that the xaxis is the dependent variable and yaxis represent the kernel density. Yaxis is in decimal numbers like from 0 to 0.15 . How do I explain this to the other users? There is a 15% chance that the simulated values will fall between x1 and x2?

I'm running simulation on a linear model. I get 1000 results and the results are put into a density chart. I do understand that the xaxis is the dependent variable and yaxis represent the kernel density. Yaxis is in decimal numbers like from 0 to 0.15 . How do I explain this to the other users? There is a 15% chance that the simulated values will fall between x1 and x2?

This is my simulation output:

summary(s)

Model:  ls 
Number of simulations:  1000 

Values of X
  (Intercept)  Volume
1           1 1699992
attr(,"assign")
[1] 0 1

Expected Values: E(Y|X) 
    mean    sd    50% 2.5%  97.5%
1 12.305 2.638 12.231 7.03 17.512

enter image description here

Source Link
user1471980
  • 745
  • 3
  • 11
  • 21

Explain Kernel density chart

I'm running simulation on a linear model. I get 1000 results and the results are put into a density chart. I do understand that the xaxis is the dependent variable and yaxis represent the kernel density. Yaxis is in decimal numbers like from 0 to 0.15 . How do I explain this to the other users? There is a 15% chance that the simulated values will fall between x1 and x2?