Comment continued: Notice that the small sample hereinmmy first example is very much smaller than you are suggesting in your Question.
Demonstration of K-W test where one level has very small sample size.
With sample sizes 4, 200, 100, and a difference of 15 between population group means, the K-W test does not give a significant result
set.seed(1121)
x1 = rnorm(4, 95, 10)
x2 = rnorm(200, 110, 10)
x3 = rnorm(100, 110, 10)
x = c(x1,x2,x3)
g = rep(1:3, times=c(4,200,100))
kruskal.test(x ~ g)

        Kruskal-Wallis rank sum test

data:  x by g
Kruskal-Wallis chi-squared = 5.2646, df = 2,
 p-value = 0.07191
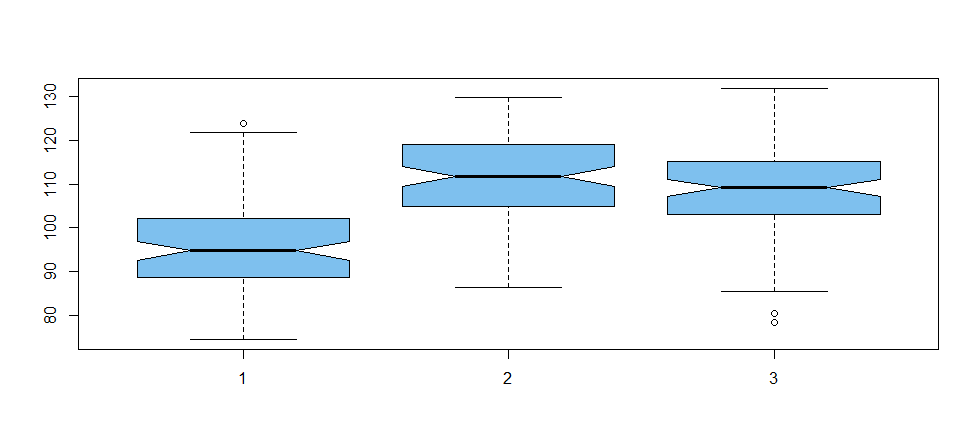
In a similar situation with 100 observations at each level, the difference is found to be very highly significant.
set.seed(1122)
x1 = rnorm(100, 95, 10)
x2 = rnorm(100, 110, 10)
x3 = rnorm(100, 110, 10)
x = c(x1,x2,x3)
g = rep(1:3, each=100)
kruskal.test(x ~ g)

        Kruskal-Wallis rank sum test

data:  x by g
Kruskal-Wallis chi-squared = 97.804, df = 2,
 p-value < 2.2e-16
Notches in the boxplots below are nonparametric confidence intervals calibrated so that, roughly speaking, non-overlapping CIs suggest a difference in location between two levels. (In the first example, it would be problematic to make a boxplot with only 4 observations at the first level.)
boxplot(x ~ g, col="skyblue2", notch=T)

