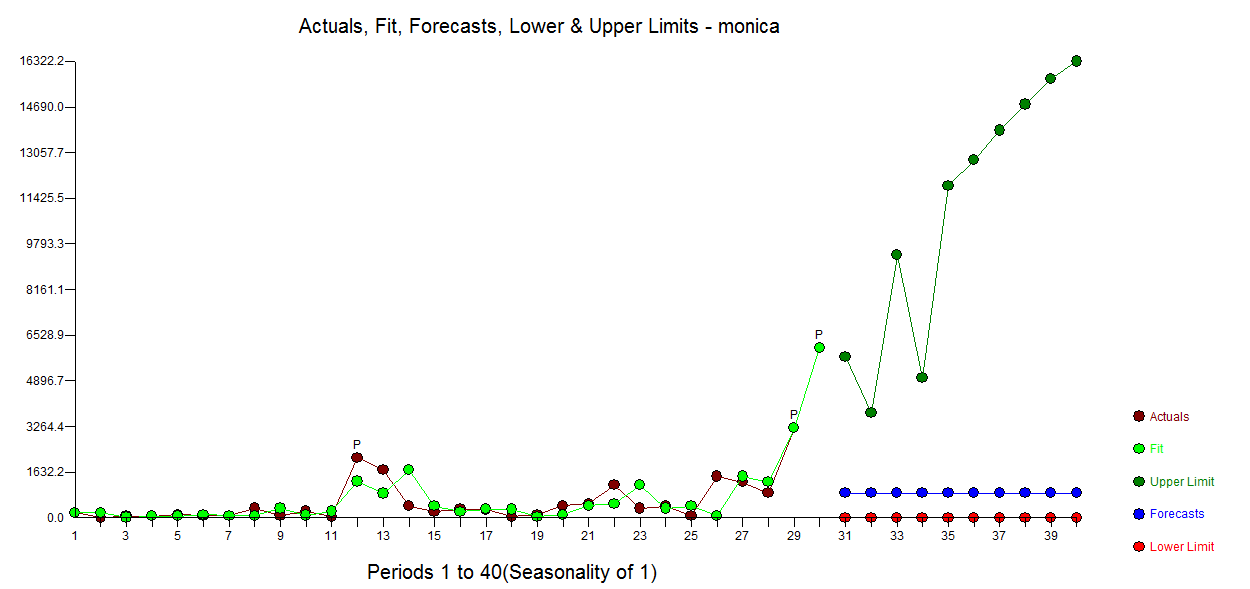
I took your 29 days (oldest to newest) and found that there were 3 unusual days thus the following equation  with Actual/Fit and Forecast here
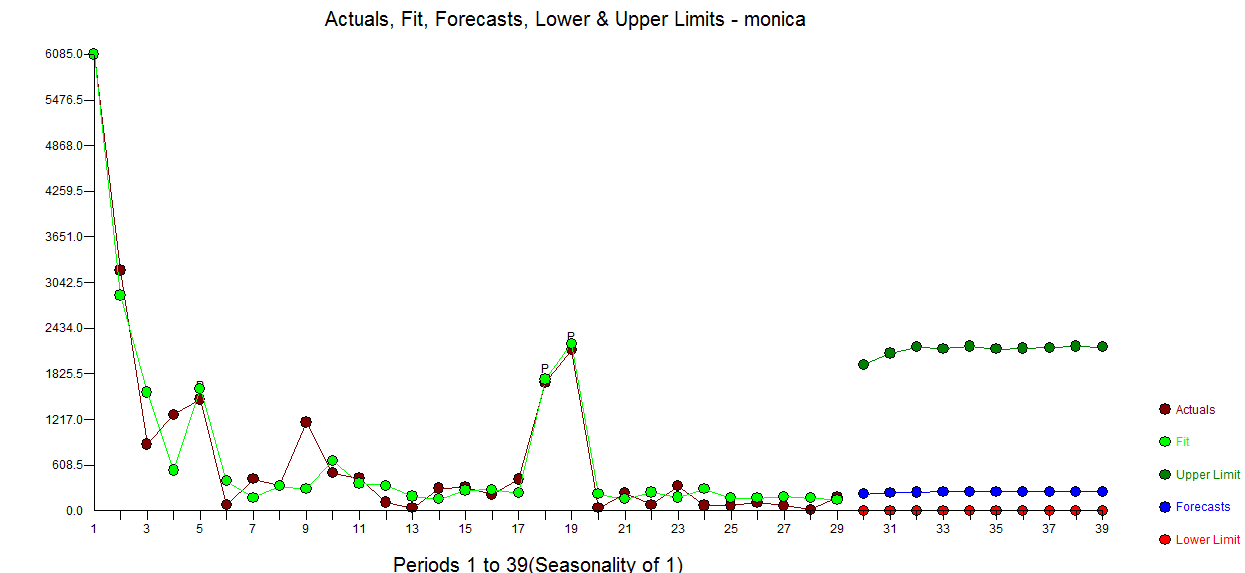
All models are wrong ... but some are useful .... . It is fundamentally an autoregressive process of order 1 after one has adjusted for the three "unusual data points " see 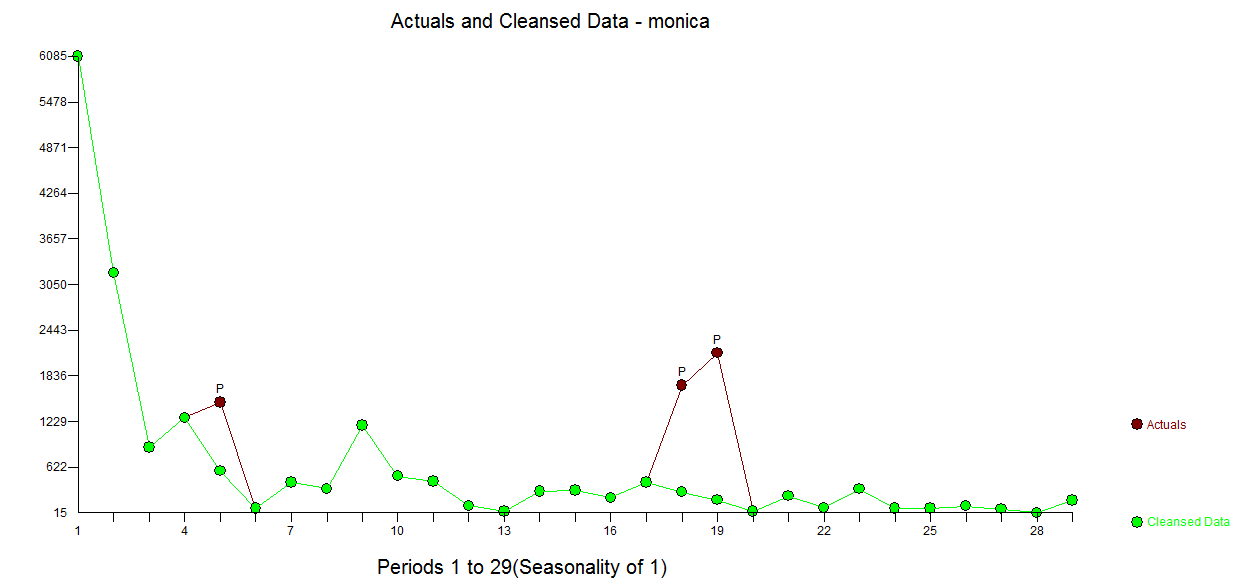 for a clear support for the anomaly identification.
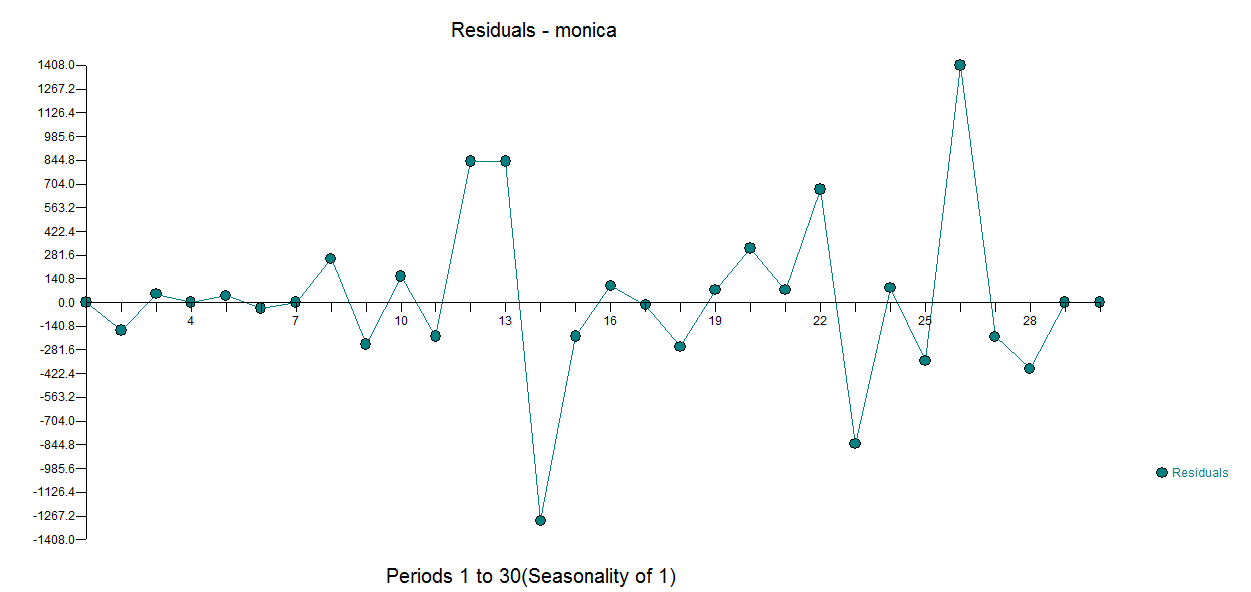
Plot of the residuals 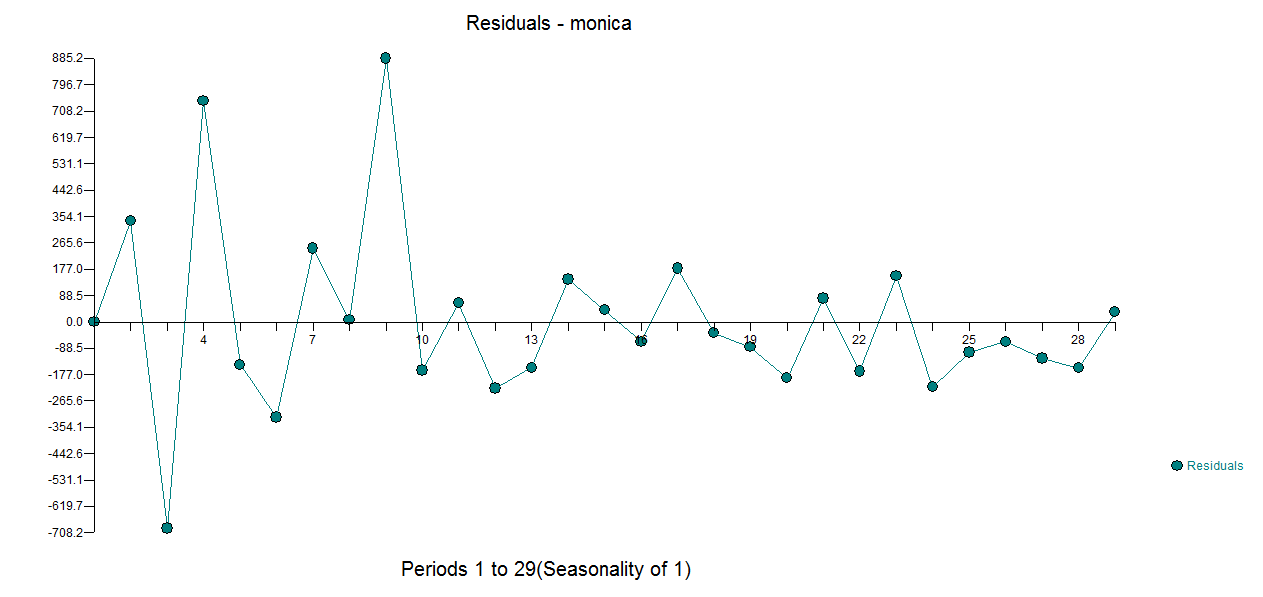 from the above model suggesting reduced variability is clearly obvious . It is reasonable to suggest that there has been a break-point in the model error variance suggesting GLS or a weighted model . This was not not investigated here due to sample size ! ).
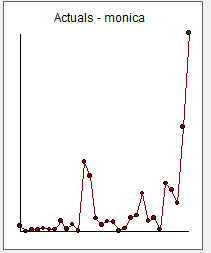
Here is the plot of the original data 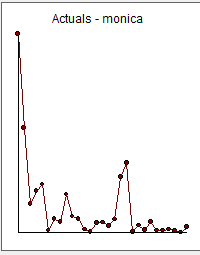
While the variability of the series is higher at higher values suggesting to some that there is a need for logarithms When (and why) should you take the log of a distribution (of numbers)? ..it is truer yet that the error variance distribution is better characterized as having a deterministic change point at or about day 11.

