Many tiny fixes, mainly spacing before punctiation.
Source Link

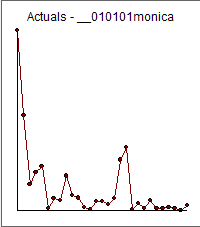
You asked " how“how do I do this with the log-link function and quasi(Poisson) errors? )" . I say put aside your priors suggesting a particular fixed model and use a data-driven empirical process to identify the (possible) memory model  , refining parameters and testing both necessity and sufficiency  .

Wenter image description herehen

When you only have 29 days ( 44 seasons of daily data  )  , I am normally reluctant to enable the automatic process to consider seasonal activity like day 6 as the OP has smartly viewed and pointed out ... a win for the human  !

Following is the audit trail .... the ACF of the original series is here  :

enter image description here

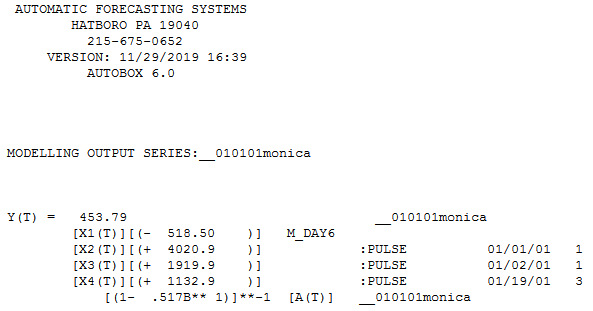
. I suggested the possibility of a day 6 effect to the software which then identified supported that hypothesis while detecting three unusual points while incorporating an ar(1) effect shown here and here enter image description here and the companion PACF of the original series here  :
enter image description here .

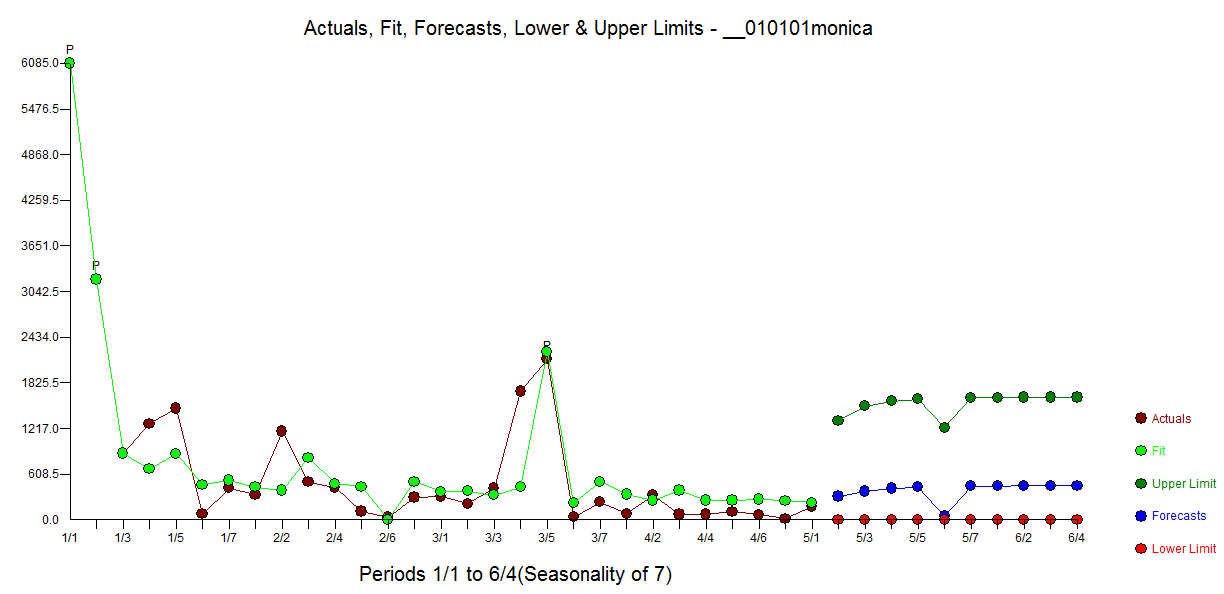
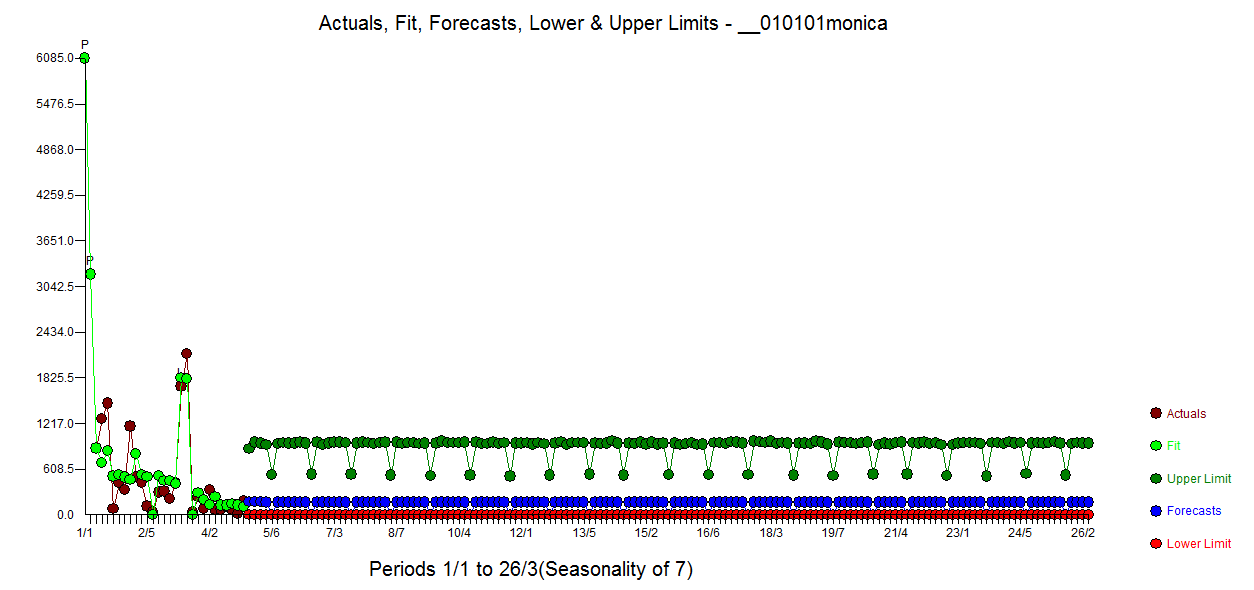
The Actual/Fit and Forecast is here  :

enter image description here 

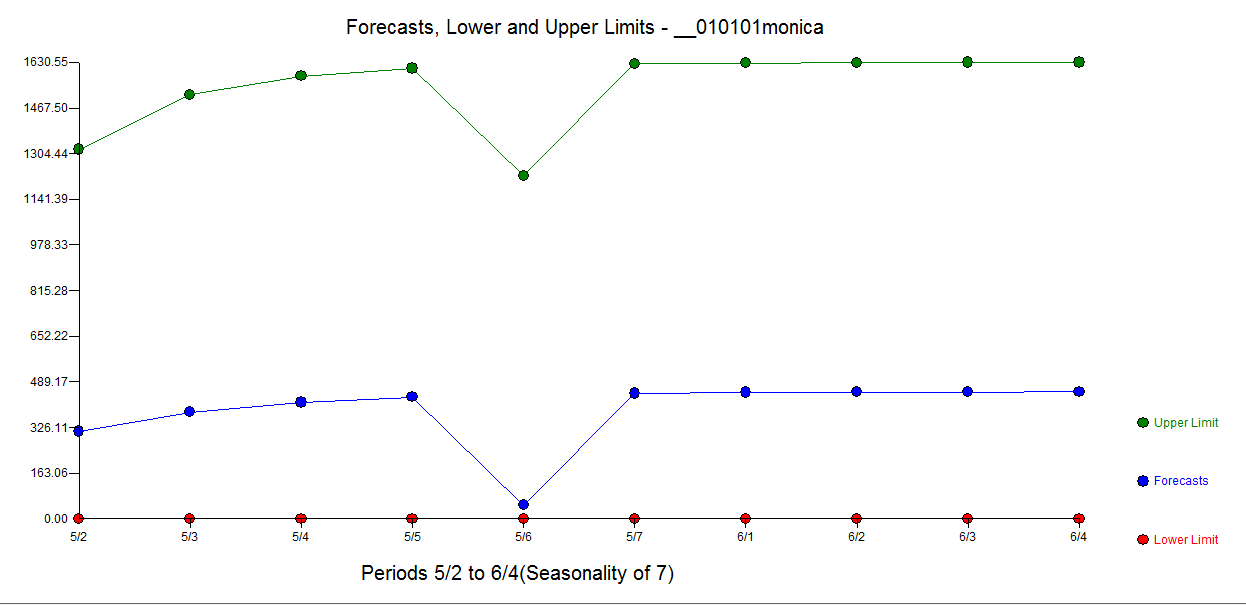
with forecasts here  :

enter
image description hereenter image description here   

... all without assuming logarithms or any other possible unwarranted transformation.

Logs can be useful but the suggestion for a power transform for an atheoretica theoretic model should never be made based upon the original data but on the residuals from a model which is where all the assumptions are placed that need to be tested. When (and why) should you take the log of a distribution (of numbers)?

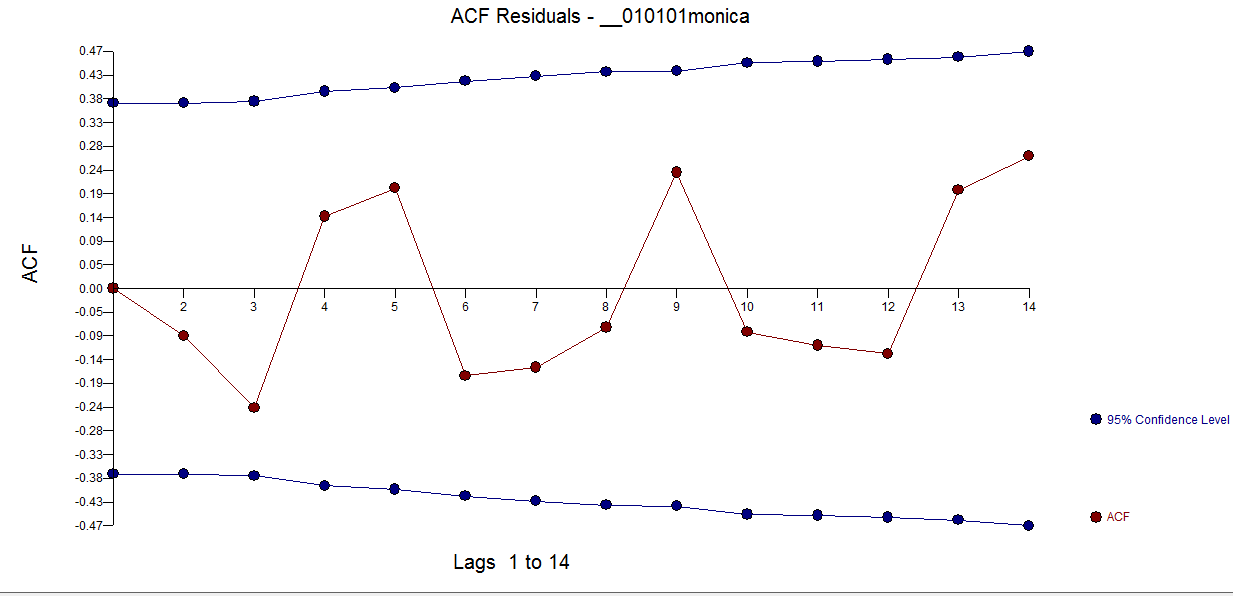
Notice the ACF of the residuals series suggesting that it that the model can not be proven to be insufficient .  

enter image description here 

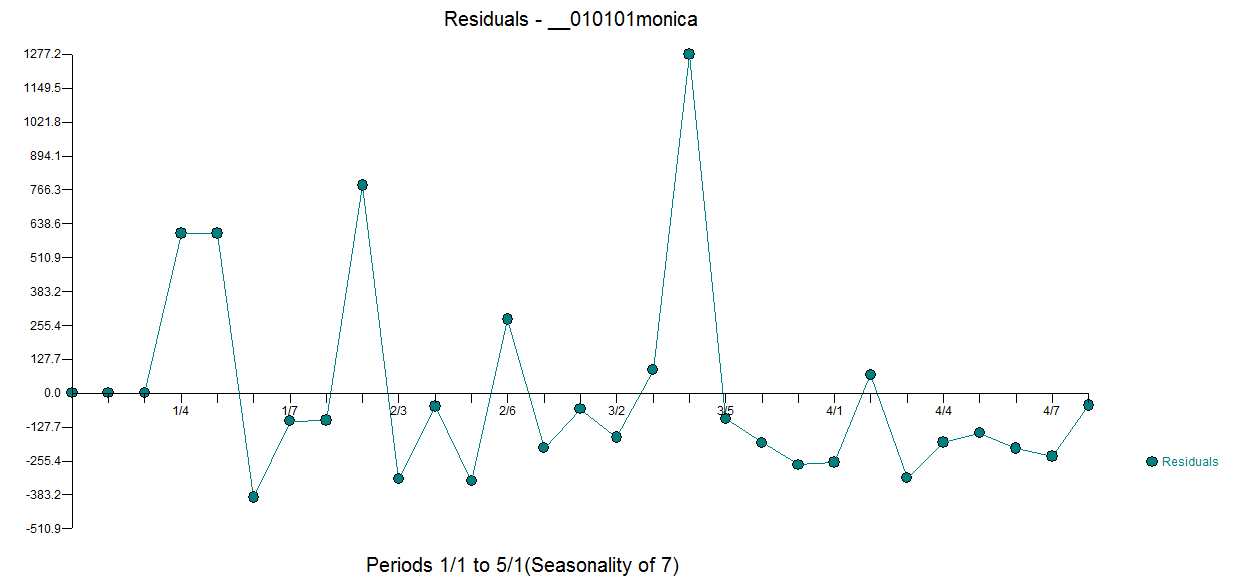
and a supporting (not quite perfect !) residual plot here  :

enter image description here

As Isaac Asimov said "the“the only education is self-education"education” and your question is certainly in that spirit.

You asked " how do I do this with the log-link function and quasi(Poisson) errors? )" . I say put aside your priors suggesting a particular fixed model and use a data-driven empirical process to identify the (possible) memory model  , refining parameters and testing both necessity and sufficiency  .

Wenter image description herehen you only have 29 days ( 4 seasons of daily data  )  , I am normally reluctant to enable the automatic process to consider seasonal activity like day 6 as the OP has smartly viewed and pointed out ... a win for the human  !

Following is the audit trail .... the ACF of the original series is here  enter image description here

. I suggested the possibility of a day 6 effect to the software which then identified supported that hypothesis while detecting three unusual points while incorporating an ar(1) effect shown here and here enter image description here and the companion PACF of the original series here  enter image description here .

The Actual/Fit and Forecast is here  enter image description here with forecasts here  enter
image description here  ... all without assuming logarithms or any other possible unwarranted transformation.

Logs can be useful but the suggestion for a power transform for an atheoretic model should never be made based upon the original data but on the residuals from a model which is where all the assumptions are placed that need to be tested. When (and why) should you take the log of a distribution (of numbers)?

Notice the ACF of the residuals series suggesting that it that the model can not be proven to be insufficient . enter image description here and a supporting (not quite perfect !) residual plot here  enter image description here

As Isaac Asimov said "the only education is self-education" and your question is certainly in that spirit.
You asked “how do I do this with the log-link function and quasi(Poisson) errors?. I say put aside your priors suggesting a particular fixed model and use a data-driven empirical process to identify the (possible) memory model, refining parameters and testing both necessity and sufficiency.

enter image description here

When you only have 29 days (4 seasons of daily data), I am normally reluctant to enable the automatic process to consider seasonal activity like day 6 as the OP has smartly viewed and pointed out ... a win for the human!

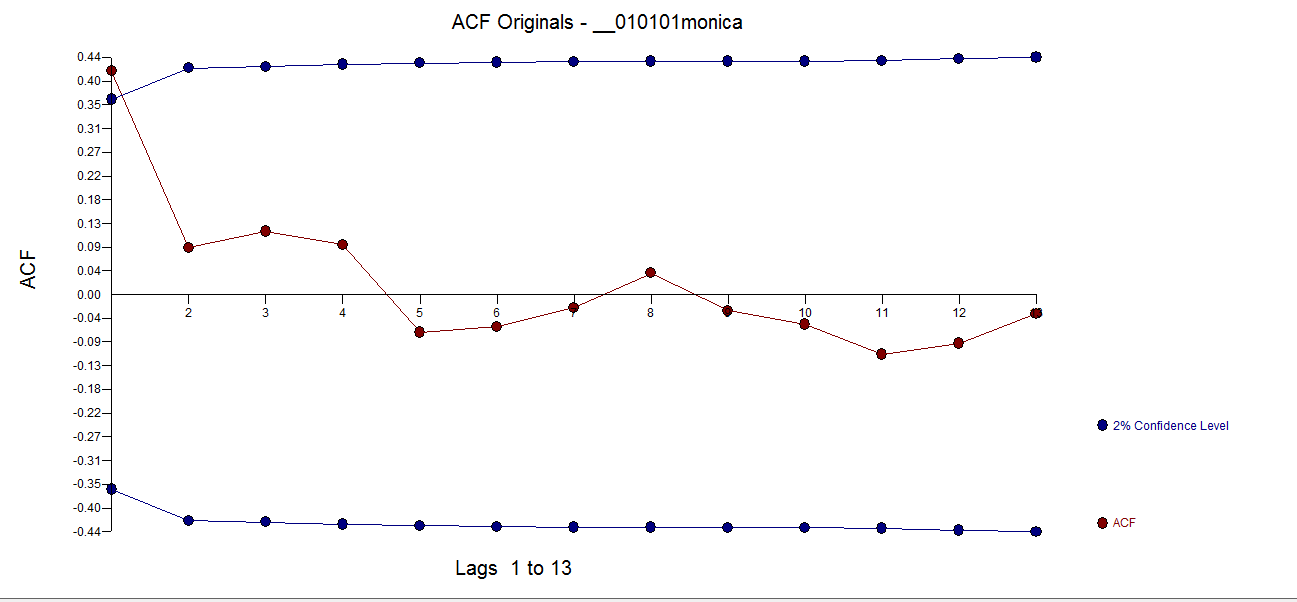
Following is the audit trail .... the ACF of the original series is here:

enter image description here

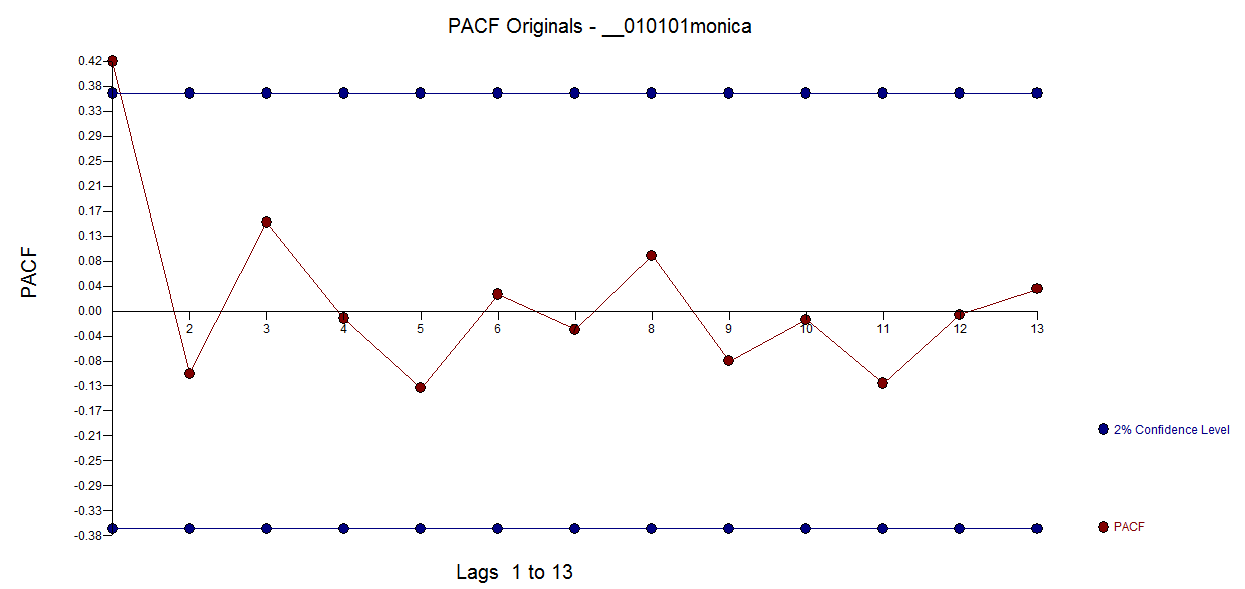
I suggested the possibility of a day 6 effect to the software which then identified supported that hypothesis while detecting three unusual points while incorporating an ar(1) effect shown here and here enter image description here and the companion PACF of the original series here:

enter image description here

The Actual/Fit and Forecast is here:

enter image description here 

with forecasts here:

enter image description here 

... all without assuming logarithms or any other possible unwarranted transformation.

Logs can be useful but the suggestion for a power transform for a theoretic model should never be made based upon the original data but on the residuals from a model which is where all the assumptions are placed that need to be tested. When (and why) should you take the log of a distribution (of numbers)?

Notice the ACF of the residuals series suggesting that it that the model can not be proven to be insufficient 

enter image description here 

and a supporting (not quite perfect !) residual plot here:

enter image description here

As Isaac Asimov said “the only education is self-education” and your question is certainly in that spirit.
Bounty Ended with 200 reputation awarded by Sextus Empiricus
added 82 characters in body
Source Link
IrishStat
  • 30k
  • 5
  • 36
  • 60

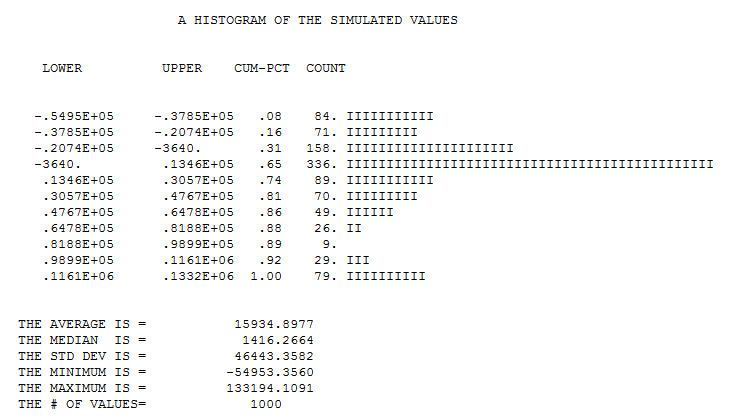
If I further assumed logs , I would expect the prediction to be even lower .

enter image description here

enter image description here

If I further assumed logs , I would expect the prediction to be even lower .

enter image description here

added 217 characters in body
Source Link
IrishStat
  • 30k
  • 5
  • 36
  • 60

After adding the level shift indicator to the model ..here it is and the sum of the 149 day simulated predictions . much lower due to the level shift down at period 20 enter image description here

enter image description here

After adding the level shift indicator to the model ..here it is and the sum of the 149 day simulated predictions . much lower due to the level shift down at period 20 enter image description here

enter image description here

deleted 1 character in body
Source Link
IrishStat
  • 30k
  • 5
  • 36
  • 60
Loading
added 118 characters in body
Source Link
IrishStat
  • 30k
  • 5
  • 36
  • 60
Loading
added 334 characters in body
Source Link
IrishStat
  • 30k
  • 5
  • 36
  • 60
Loading
added 248 characters in body
Source Link
IrishStat
  • 30k
  • 5
  • 36
  • 60
Loading
added 1265 characters in body
Source Link
IrishStat
  • 30k
  • 5
  • 36
  • 60
Loading
added 306 characters in body
Source Link
IrishStat
  • 30k
  • 5
  • 36
  • 60
Loading
added 122 characters in body
Source Link
IrishStat
  • 30k
  • 5
  • 36
  • 60
Loading
Source Link
IrishStat
  • 30k
  • 5
  • 36
  • 60
Loading