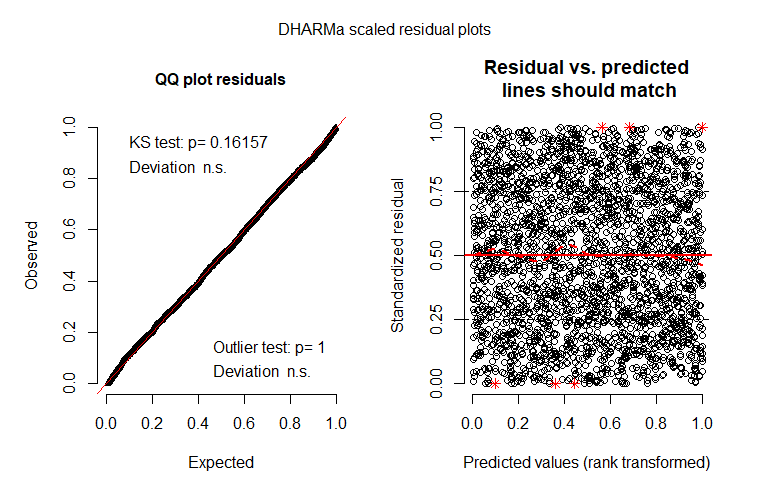
I used glmmTMB to fit a model with beta distributed errors, zero inflation, several nested random effects and temporal correlation. I then used the diagnostic plots available in DHARMa. My residual vs predicted plot looks like this  The plot is (I think) similar to the one shown in the other packages section of the DHARMa package vignette. What is the meaning of the dashed line? Also, are all three residual lines overlapping at 0.50?
Bumped by Community user
Bumped by Community user
Bumped by Community user
Bumped by Community user
Bumped by Community user
Bumped by Community user
Bumped by Community user
Bumped by Community user
Bumped by Community user
Bumped by Community user
