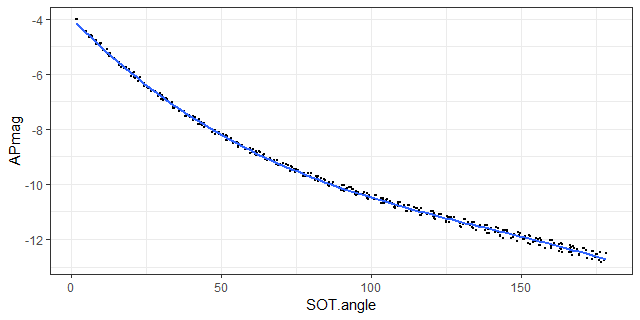
There is a confounder: The Earth's position on its orbit around the Sun determines on one hand the season (and, consequently, the ground temperature) and, on the other hand, the amount of light the Moon is receiving. There are subtle traces in the data.
The Sun-Earth-Moon angle and the Moon brightness are tightly related, which is not surprising. The Moon brightness, as observed from the Earth, is a direct consequence of the illuminated area we can observe. That area is given by the above angle. We can draw a smooth curve (3rd degree polynomial) through the points:

There is some "noise" (residuals) around the curve, but its level is so low that we might be tempted to ignore it. That, however, would be a big mistake! We are talking celestial mechanics here, not social sciences. There should be no noise at all! Everything is deterministic, and must have an explanation.
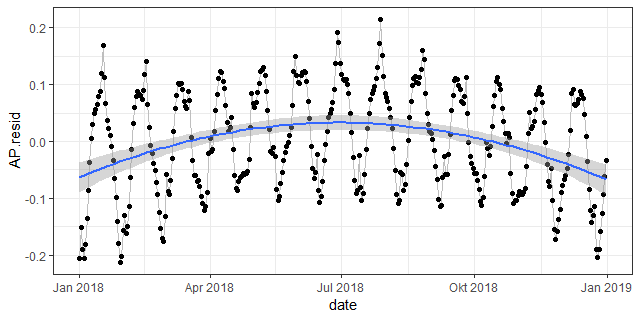
If we plot the noise against the date, another pattern emerges:

In summer (in the northern hemisphere), the residuals tend to be larger (i.e. the true Moon brightness is lower than the modeled one). Most probably, this is a result of the Earth's orbit around the Sun being is elliptical. During summer, the Earth+Moon-system is farther away from the Sun, and the Moon gets somewhat less light (the Earth too, but this is negligible here).
There is also an oscillatory pattern (13 periods a year), probably due to the Moons orbit around the Earth (also elliptic, and inclined towards the Earth's orbit), but that one doesn't account for the observed effect. This can be shown by creating an artificial "Moon brightness", modeled as a quadratic function of the date (the blue parabola in the above figure) and a cubic polynomial of SOT.angle (the smooth line in the first figure). This artificial "Moon brightness" still has a "significant" effect on the ground temperature TG!
In fact, the ground temperature can be predicted from the Moon brightness residual alone:
Call:
lm(formula = TG ~ AP.resid, data = hd2)

Residuals:
     Min       1Q   Median       3Q      Max
-15.9810  -5.5160   0.3846   6.4040  16.7107

Coefficients:
            Estimate Std. Error t value Pr(>|t|)
(Intercept)  11.6559     0.3987  29.233  < 2e-16 ***
AP.resid     29.0386     4.4487   6.527 2.26e-10 ***
---
Signif. codes:  0 ‘***’ 0.001 ‘**’ 0.01 ‘*’ 0.05 ‘.’ 0.1 ‘ ’ 1

Residual standard error: 7.618 on 363 degrees of freedom
Multiple R-squared:  0.105, Adjusted R-squared:  0.1026
F-statistic: 42.61 on 1 and 363 DF,  p-value: 2.256e-10
It is not a time-series issue. In this case, of course, the position of the celestial bodies is a function of time, but this is not the cause for the relationship in question. We could construct a laboratory experiment, with a light source, spherical mirrors, and light detectors, and perform measurements in any order we desire, and we'd still obtain the same relationship.


