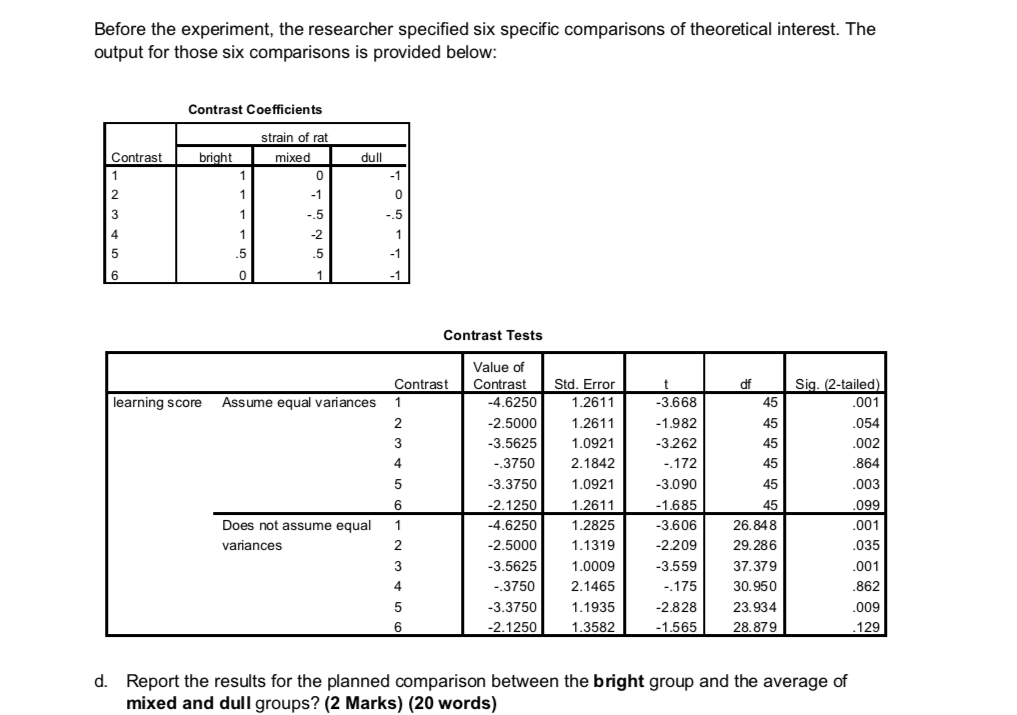
Looking at Levene's test of homogeneity of variance that was statistically significant (related to the question but i have not added it as an image). Hence, i would need to look at the "does not assume equal variance data in the table.
Hence, I would answer the question by looking at the sig fig or by subtracting the value of contrast from std error. Since, i know how to answer this question when there's only one type of data present. But i'm not sure, if i would look at the sig figs and assume whether they're statistically signficant in the "does not assume equal variance table" and create a hypothesis between the two groups?.

