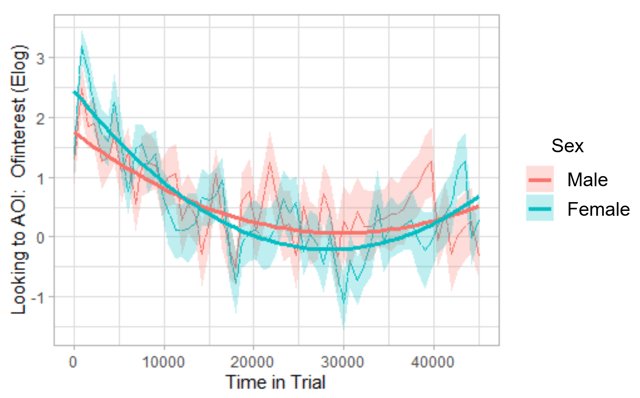
I have fit parabolas to two groups in a growth curve analysis (GCA) of eye tracking data using orthogonal polynomials (essentially by following Dan Mirman's example for his paper with Magnuson in 2009, Dynamics of activation of semantically similar concepts during spoken word recognition, which is also carried out similarly in this growth curve analysis vignette from http://www.eyetracking-r.com, which is what I used). The interaction between the orthogonal quadratic term and variable of interest, Sex, is significant, which can be seen on the graph below: The parabolas are indeed slightly different across the two sexes.
However, the main effect for Sex has a very large p-value (0.949), which makes sense to me, as I don't think these two groups are actually statistically different, despite the significant interaction term (again, conclusion supported by the plot).
I'm wondering if those experienced in GCAs can help me interpret the output in terms of the interactions and main effects in this instance. Is it appropriate to look at the main effect's p-value alone, despite the significant interaction term? Any peer-reviewed sources that specifically discuss this would be much appreciated.
Here is the plot:
And here are the hypothesis test results associated with this plot. They were obtained via the drop1() function, employing likelihood ratio tests. Note the variable Sex was coded with deviation coding (-0.5, 0.5), then subsequently centered. ot1 and ot2 are the orthogonal linear and quadratic terms, respectively.
                       npar   AIC     LRT   Pr(Chi)
<none>                      44701
Sex_c_centered            1 44699   0.004  0.948733
ot1                       1 44836 136.551 < 2.2e-16 ***
ot2                       1 44815 116.134 < 2.2e-16 ***
Sex_c_centered:ot1        1 44703   4.249  0.039285 *
Sex_c_centered:ot2        1 44707   7.971  0.004752 **

