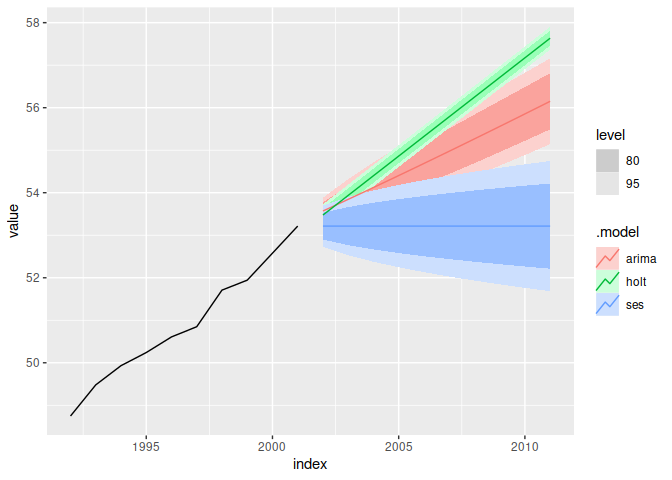
The fable package replaces the hts package and produces prediction intervals. It is also much easier to handle the aggregation structure. Here is some code using the same example as in your question (updated to include multiple models).
library(tsibble)
library(feasts)
library(fable)
library(dplyr)

df <- as_tsibble(hts::htseg1$bts) %>%
  mutate(
    level1 = substr(key, 1, 1),
    level2 = substr(key, 2, 2)
  ) %>%
  as_tsibble(index=index, key=c(level1,level2)) %>%
  select(-key) %>%
  aggregate_key(level1/level2, value = sum(value))

fc <- df %>%
  model(
    ses = ETS(value ~ trend("N") + season("N")),
    holt = ETS(value ~ trend("A") + season("N")),
    arima = ARIMA(value)
  ) %>%
  reconcile(mint
    ses = min_trace(ses),
    holt = min_trace(holt),
    arima = min_trace(arima)
  ) %>%
  forecast(h=10)
fc %>%
  filter(.model=="mint", is_aggregated(level1)) %>%
  autoplot(df)


fc %>%
  mutate(PI = hilo(value, level=95))
#> # A fable: 160240 x 7 [1Y]
#> # Key:     level1, level2, .model [16][24]
#>    level1 level2 .model index         value .mean                      PI
#>    <chr*> <chr*> <chr>  <dbl>        <dist> <dbl>                  <hilo>
#>  1 A      A      arimases     2002 N(9.12, 0.048031)  9.1115 [8.682833807747,  9.545839]95497520]95
#>  2 A      A      arimases     2003 N(9.12, 0.091062)  9.0815 [8.487620664913,  9.669394]95640354]95
#>  3 A      A      arima ses  2004   2004 N(9.2, 0.13093)  9.0415 [8.343733555308,  9.746244]95749959]95
#>  4 A      A      arimases   2005  2005  N(9.2, 0.1612)  9.0115 [8.228413462905,  9.798851]95842362]95
#>  5 A      A      arimases   2006  2006  N(9.2, 0.1915)  89.9815 [8.132359381495,  9.836236]95923773]95
#>  6 A      A      arimases   2007  2007  N(9.2, 0.2119)  89.9615 [8.050547307893,  9.863163]95997374]95
#>  7 A      A      arimases     2008  N(8.9.2, 0.2422)  89.9315 [7[8.979837240208, 910.882527]95065059]95
#>  8 A      A      arimases     2009  N(8.9.2, 0.25)  89.9115 [7[8.918087177208, 910.896244]95128059]95
#>  9 A      A      arimases     2010  N(8.9.2, 0.2728)  89.8815 [7[8.863739118037, 910.905656]95187231]95
#> 10 A      A      arimases     2011  N(8.9.2, 0.2931)  89.8615 [7[8.815615062070, 910.911742]95243198]95
#> # … with 150230 more rows
Created on 2020-10-2224 by the reprex package (v0.3.0)
