Overview
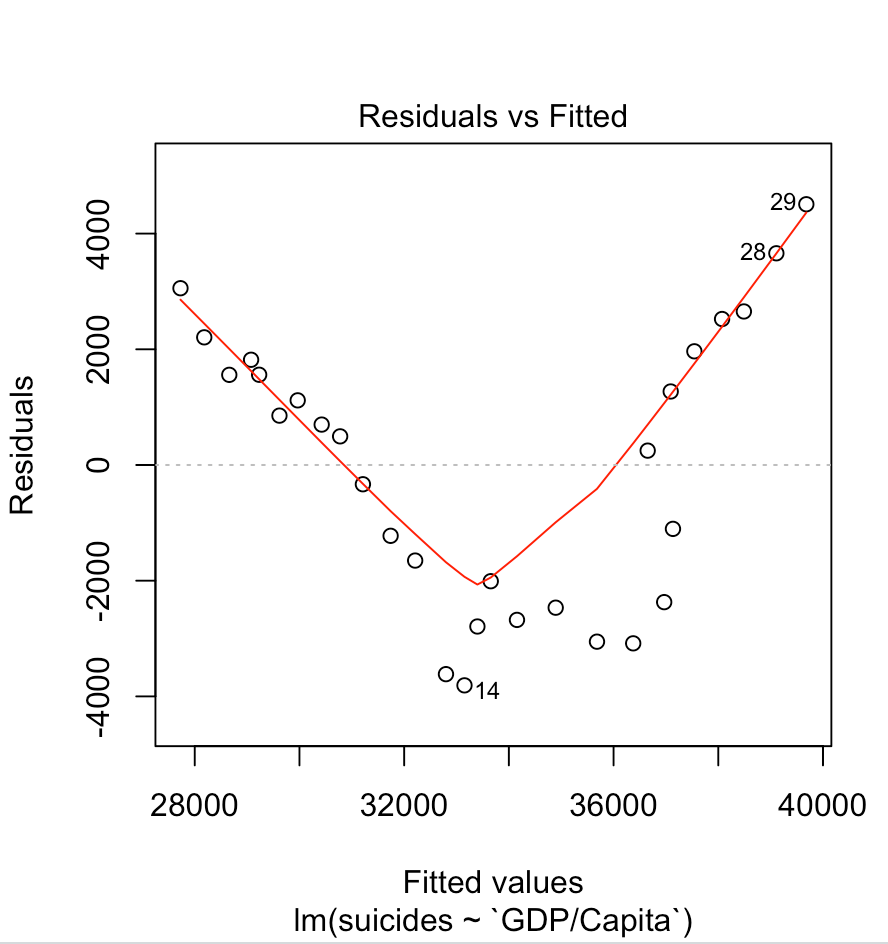
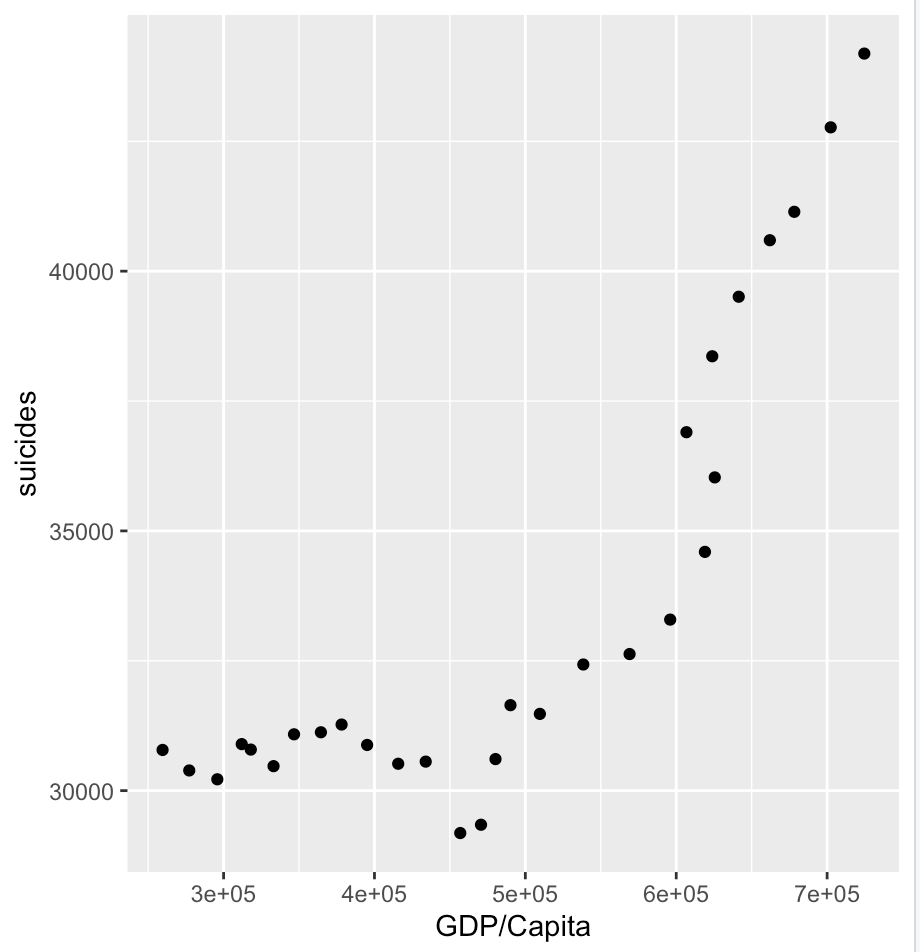
I built a linear regression model using the lm() function in R, and the linearity assumption has been violated. All other assumptions have been met. I tried a multitude of transformations on the predictor, but that didn't improve the linearity. The independent variables is U.S. GDP/Capita in a specific year, and the dependent variable is number of suicides in a specific year in the U.S. The regression model has a significant F-statistic and a R-squared value of .69.
The Data (only the first 2 rows)
| year | | gdp/capita | | suicides |
| ---- | | ---------- | | -------- |
| 1987 | | 259574.2   | | 30784    |
| 1988 | | 277240.9   | | 30388    |
Scatter Plot of the Data
Residuals vs Fitted Plot indicating non-linearity
Any help would be much appreciated!

