added 1593 characters in body
Source Link
Lodore66
  • 167
  • 1
  • 9

EDIT 2: This is my full data, long form:

Group   entropy
1   6.71905356
1   0.56407487
1   0.738029138
1   0.630035416
1   3.017076375
1   2.510090903
1   0.254787047
1   0.376719953
1   0.456298101
1   0.328258469
1   0.767253283
1   0.641643213
1   2.905235741
1   3.615227362
1   0.244727319
1   2.317604878
1   1.504713298
1   0.999700392
1   0.669730607
1   0.766398132
1   0.449555621
1   0.360902977
1   0.297898424
1   1.399111031
1   0.67895411
1   0.56984134
1   0.536010552
1   2.226602414
1   1.998649951
1   0.220619041
1   0.547186366
1   0.446506256
1   0.495662791
1   0.458900635
0   1.699580285
0   1.017646859
0   0.618058775
0   0.740520854
0   0.558418925
0   0.264262271
0   1.4136416
0   0.538862166
0   2.089605078
0   2.206855803
0   0.494698728
0   0.36284015
0   0.947420619
0   1.515928283
0   0.682302263
0   0.515864165
0   0.400418084
0   0.401584527
0   1.195820577
0   0.544921866
0   0.284516915
0   1.902155181
0   1.095376897
0   0.263003363
0   0.674095659
0   3.939129819
0   0.617625765
0   0.364223021
0   0.355701427
0   0.887284165
0   0.312722361
0   0.570313528
0   0.4107156
0   0.453855313
0   1.441497841
1   1.720034593
1   0.590291826
1   0.444819008
0   0.252508237
0   1.226010557
0   0.526118886
0   1.046928619
0   0.679454156
1   0.617128565
added 637 characters in body
Source Link
Lodore66
  • 167
  • 1
  • 9

I have two distributions and I want to test whether there's an inequality of variances. They're non-normal, so Levene's test is appropriate. The scipy implementation offers three options: test on the mean, the median, and the trimmed mean. The trimmed mean is appropriate for heavy tailed distributions.

My question is, how do I know if my distribution is heavy-tailed? My understanding is that it's heavy-tailed if it's not exponentially bounded. I've tried to check this but I'm not sure if my method is correct. Here's what I did:

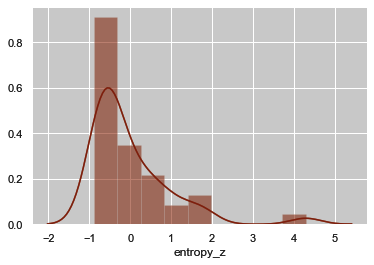
  1. Converted my data into z-scores so as to standardise it and plotted it.

enter image description here

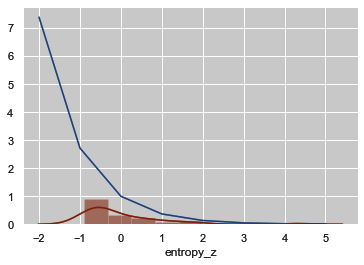
  1. Plotted the exponential distribution function across the range of my data, plotted it.

  2. Compared the two visually.

enter image description here

EDIT: I'm here adding some descriptive statistics about my two distributions in response to the comments. This is the raw data, not the z scores.

Distribution 1: 

count    38.000000
mean      1.160140
std       1.281058
min       0.220619
25%       0.451241
50%       0.623582
75%       1.478313
kurtosis  7.57
max       6.719054

Distribution 2: 

count    40.000000
mean      0.887812
std       0.720215
min       0.252508
25%       0.408433
50%       0.617842
75%       1.120488
kurtosis  6.27
max       3.939130

My conclusion is that my distribution is not heavy tailed, but I'm not confident about it. Can anyone advise?

I have two distributions and I want to test whether there's an inequality of variances. They're non-normal, so Levene's test is appropriate. The scipy implementation offers three options: test on the mean, the median, and the trimmed mean. The trimmed mean is appropriate for heavy tailed distributions.

My question is, how do I know if my distribution is heavy-tailed? My understanding is that it's heavy-tailed if it's not exponentially bounded. I've tried to check this but I'm not sure if my method is correct. Here's what I did:

  1. Converted my data into z-scores so as to standardise it and plotted it.

enter image description here

  1. Plotted the exponential distribution function across the range of my data, plotted it.

  2. Compared the two visually.

enter image description here

EDIT: I'm here adding some descriptive statistics about my two distributions in response to the comments. This is the raw data, not the z scores.

Distribution 1: 

count    38.000000
mean      1.160140
std       1.281058
min       0.220619
25%       0.451241
50%       0.623582
75%       1.478313
kurtosis  7.57
max       6.719054

Distribution 2: 

count    40.000000
mean      0.887812
std       0.720215
min       0.252508
25%       0.408433
50%       0.617842
75%       1.120488
kurtosis  6.27
max       3.939130

My conclusion is that my distribution is not heavy tailed, but I'm not confident about it. Can anyone advise?

deleted 2 characters in body
Source Link
Lodore66
  • 167
  • 1
  • 9

I have two distributions and I want to test whether there's an inequality of variances. They're non-normal, so Bartlett'sLevene's test is appropriate. The scipy implementation offers three options: test on the mean, the median, and the trimmed mean. The trimmed mean is appropriate for heavy tailed distributions.

My question is, how do I know if my distribution is heavy-tailed? My understanding is that it's heavy-tailed if it's not exponentially bounded. I've tried to check this but I'm not sure if my method is correct. Here's what I did:

  1. Converted my data into z-scores so as to standardise it and plotted it.

enter image description here

  1. Plotted the exponential distribution function across the range of my data, plotted it.

  2. Compared the two visually.

enter image description here

My conclusion is that my distribution is not heavy tailed, but I'm not confident about it. Can anyone advise?

I have two distributions and I want to test whether there's an inequality of variances. They're non-normal, so Bartlett's test is appropriate. The scipy implementation offers three options: test on the mean, the median, and the trimmed mean. The trimmed mean is appropriate for heavy tailed distributions.

My question is, how do I know if my distribution is heavy-tailed? My understanding is that it's heavy-tailed if it's not exponentially bounded. I've tried to check this but I'm not sure if my method is correct. Here's what I did:

  1. Converted my data into z-scores so as to standardise it and plotted it.

enter image description here

  1. Plotted the exponential distribution function across the range of my data, plotted it.

  2. Compared the two visually.

enter image description here

My conclusion is that my distribution is not heavy tailed, but I'm not confident about it. Can anyone advise?

I have two distributions and I want to test whether there's an inequality of variances. They're non-normal, so Levene's test is appropriate. The scipy implementation offers three options: test on the mean, the median, and the trimmed mean. The trimmed mean is appropriate for heavy tailed distributions.

My question is, how do I know if my distribution is heavy-tailed? My understanding is that it's heavy-tailed if it's not exponentially bounded. I've tried to check this but I'm not sure if my method is correct. Here's what I did:

  1. Converted my data into z-scores so as to standardise it and plotted it.

enter image description here

  1. Plotted the exponential distribution function across the range of my data, plotted it.

  2. Compared the two visually.

enter image description here

My conclusion is that my distribution is not heavy tailed, but I'm not confident about it. Can anyone advise?

Source Link
Lodore66
  • 167
  • 1
  • 9
Loading